The Conference Board’s US Leading Economic Index (LEI) fell by 0.7% in March, pointing to slowing economic activity in the near term.
March’s decline coincided with soaring economic uncertainty ahead of tariff announcements. Consumer expectations fell, and stock prices experienced their largest monthly decline since September 2022.
The Conference Board stresses that its index does not suggest an impending recession but revised its 2025 US GDP forecast to just 1.6%.
2. CONSUMER SENTIMENT
According to data from the University of Michigan, US consumer sentiment plummeted in April from an index level of 57 in March to 50.8, its lowest since June 2022.
It was the fourth consecutive monthly decline in consumer sentiment, while the index has contracted more than 30% since December.
Moreover, a sub-index of the survey that zeros in on consumers’ short-term expectations fell to its lowest since May 1980.
Growing concerns about the trade war and elevated economic uncertainty, two forces that have reached a crescendo in recent weeks, are driving the decline.
According to the survey’s researchers at the University of Michigan, the latest survey results contained several potential recessionary signals, with consumers reporting falling expectations for business conditions, personal finances, incomes, inflations, and the labor market.
3. BEIGE BOOK
The seal of the U.S. Federal Reserve Board of Governors across the street from the Marriner S. Eccles Federal Reserve building in Washington, D.C., U.S., on Sunday, Dec. 19, 2021. The Federal Reserve chair has tempered his ambition to restore the labor market to its pre-pandemic strength, as the central bank confronts surging inflation and a workforce still constrained by Covid-19. Photographer: Samuel Corum/Bloomberg via Getty Images
According to the Federal Reserve’s latest Beige Book summary of economic activity, economic activity was mostly flat during the six weeks ending on April 14th, 2025, with just five Fed Districts reporting even slight growth.
Trade policy uncertainty was a dominant theme in the beige book, affecting everything from hiring to capital planning. Tariffs are already pushing firms to change how they price, hire, and forecast.
Consumer spending softened during the period, while the Multifamily sector drove commercial real estate activity.
Manufacturing was mixed, while labor markets appeared to be stalling out as headcounts fell in sectors tied to government and nonprofits. Wages are still rising but at a slower pace.
4. DURABLE GOODS
New orders for manufactured durable goods soared in March, rising 9.2% month-over-month to $315.7 billion. It is the third consecutive monthly increase in purchases and far exceeded market expectations of 2%.
The significant increase is likely a lagging signal as firms rushed planned orders of transit-related goods amid rising short-term economic uncertainty.
Purchases of commercial aircraft drove the uptick, with transportation equipment orders up 27.0%. Outside of transportation equipment, new orders were mostly flat.
Orders for non-defense capital goods, which serves as a proxy for business spending plans, ticked up slightly by 0.1% in March, rebounding from a 0.3% fall in February.
5. RETAIL SALES
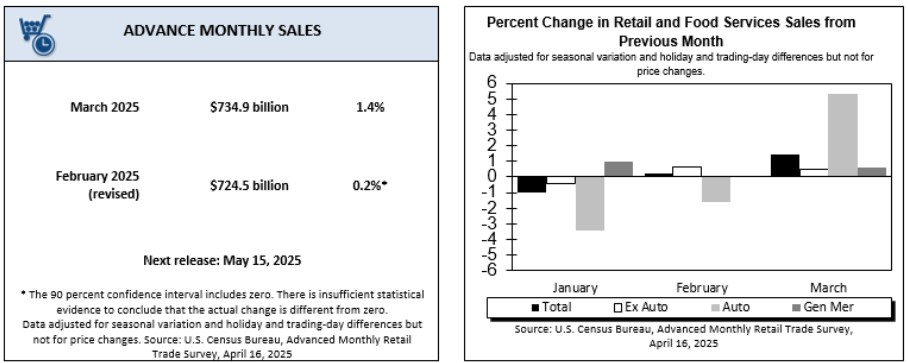
US retail sales climbed 1.4% month-over-month in March, performing slightly better than forecasts. It was the highest increase in retail sales since January 2023, but the surge may reflect pull-forward demand from rising trade and economic uncertainty.
A rapid increase in consumer buying activity drove a 5.3% increase in motor vehicle and parts sales. Excluding autos, retail sales rose just 0.5%.
Other significant increases include purchases of building materials and garden equipment (+3.3), sporting goods and hobby stores (+2.4%), and food services and drinking places (+1.8%). Sales declined at gas stations (-2.5%) and furniture stores (-0.7%).
6. COMMERCIAL PROPERTY PRICES
According to Green Street’s Commercial Property Price Index, commercial-wide property prices rose 0.3% in March and were essentially unchanged during the first quarter. The index is up 4.9% over the past twelve months.
Industrial transaction price growth led the major property sectors in March, rising 1.0%, while Health Care (+1.3%), Mall (1.0%), and Strip Retail (+1.0%) led secondary sectors.
Over the past 12 months, Apartment transaction prices lead major property sectors, up 12%, while Mall leads secondary sectors, up 15%.
Office transaction prices fell by 2.0% in March, as did Self-Storage. Over the past twelve months, Self-Storage transaction prices have had the steepest declines, down 5.0%, followed by Lodging, down 4.0%.
7. NEW RESIDENTIAL CONSTRUCTION
Housing construction starts in the US plummeted 11.4% month-over-month in March to a seasonally adjusted annualized rate of 1.32 million, its lowest annualized projection in four months.
The fall in housing starts during March was the biggest in a year and followed a 9.8% surge in February.
Single-family housing starts fell 14.2% to an annualized rate of 0.94 million. Multifamily housing starts were unchanged at an annualized rate of 0.37 million.
Regionally, housing starts fell in the West (-30.9% to a rate of 0.28 million) followed by the South (-17.1% to a rate of 0.67 million). Starts rose in the Midwest (76.2% to a rate of 0.22 million) and the Northeast (1.4% to a rate of 0.140 million).
8. INDEPENDENT LANDLORD RENTAL PERFORMANCE
According to Chandan Economics-RentRedi Independent Landlord Rental Performance Report, the on-time payment rate in independently operated rental units jumped by 45 basis points (bps) to 86.3% In April 2025
Compared to a year earlier, on-time payments are up slightly — by eight (8) bps. April’s year-over-year improvement breaks a twenty-month streak of annual collection rate declines.
The forecast full-payment rate, which includes on-time payments, late payments, and expected late payments based on historical trends, slid slightly to 95.5% — dropping 26 bps from March. Despite the month-over-month decline, April’s full payment forecast is the second highest in the past six months.
Western states continue to hold the highest on-time payment rates in the country, led by Utah, Idaho, Alaska, Wyoming, and New Mexico.
2-4-family rental properties rentals held the highest on-time payment rates in April, coming in at 87.0%.
9. MORTGAGE RATES RISE, DEMAND FALLS
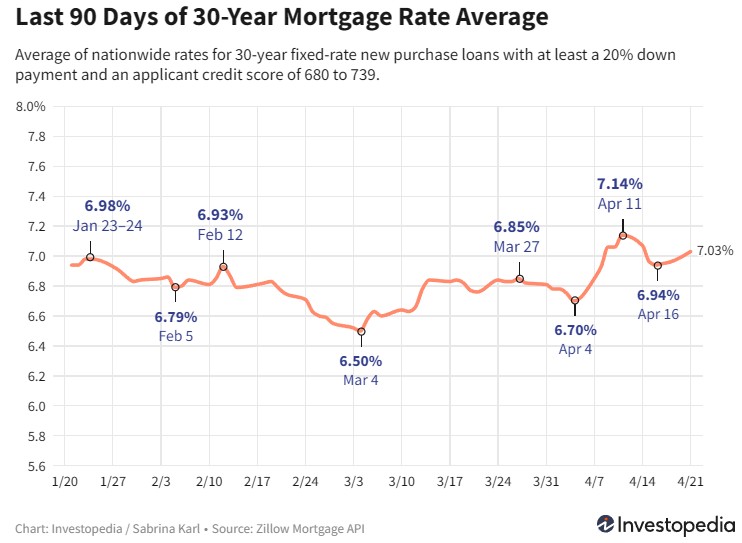
Recent treasury market volatility has induced dramatic swings in mortgage rates, with the average contract rate on a 30-year fixed-rate mortgage hitting as low as 6.70% and as high as 7.14% across just a (7) day period in April.
For context, mortgage rates have been elevated for the past two-plus years as the Federal Reserve hiked interest rates in response to inflation. Then, 30-year rates took a historic plunge in September as the Fed pivoted to rate cuts, reaching as low as 5.89% and building the market’s anticipation for looser financial conditions.
However, by late January, the average 30-year rate was back above 7.0% and has largely remained elevated since, as concerns over the fiscal deficit and the inflationary threat of potential tariffs became more front-of-mind for markets
Early April’s mortgage rate volatility is indicative of the on-and-off nature of US tariff announcements and simultaneous reactions by the bond market, which appears to be pricing in an elevated risk to the US economy. Further, strong job growth in March has lowered the probability of a Fed rate cut in May, keeping a higher floor on mortgage rates.
10. TOP MARKETS FOR RENTAL OCCUPANCY
Grand Rapids, MI, charts the tightest rental market in the US, while the other four (4) of the top five (5) are all located in the New England Region, according to a new analysis by Chandan Economics, in partnership with Arbor Realty Trust.
The Grand Rapids rental sector is 99.2% occupied, the highest tally across the nation’s top 75 metros. It is followed by Bridgeport, CT (98.6%); Hartford, CT (98.5%), Providence, RI (98.3%), and Boston, MA (98.1%).
Meanwhile, Columbia, SC, and Memphis, TN, had the largest year-over-year improvements in occupancy levels.
Apartment vacancies rose on a national level compared to one year ago. Still, occupancy increased in 36 of the top 75 markets last year while exceeding 95% in nearly one-third.