The meeting minutes from the FOMC’s May 6-7 policy meeting show that officials see increased recession risks in the wake of tariffs, arguing that a recession is now “almost as likely” as their baseline forecast of low GDP growth for 2025.
Officials held rates unchanged at their May meeting as they wait to see where their most considerable policy risks develop, with the risks of both price stability and labor market deterioration hanging in an uncertain balance.
Meeting participants warn that they may face “difficult tradeoffs” if inflation proves to be more persistent than anticipated while the US growth outlook deteriorates. They note that economic uncertainty had increased relative to their last policy meeting, justifying their continued wait-and-see approach to rate changes.
While labor market indicators continue to prove resilient, officials note that the risk of short-term deterioration in the labor market has increased in recent months and that the outcome will heavily depend on how proposed trade and fiscal policies develop.
Officials expressed that they would be willing to amend their “wait-and-see” approach if tariffs worsen inflation pressures enough to weaken labor market fundamentals.
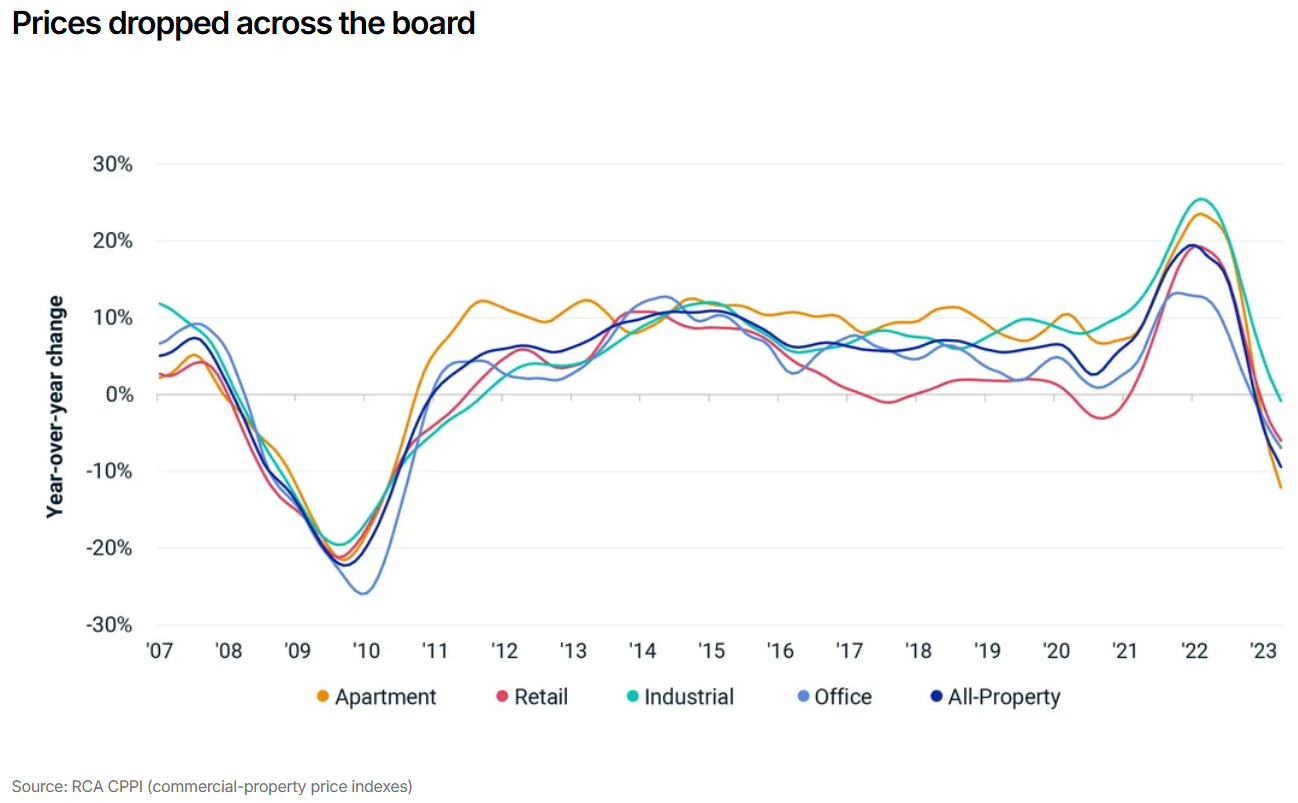
2. COMMERCIAL PROPERTY PRICES
According to MSCI Real Capital Analytics, Commercial property prices fell by 0.4% from March and are down 0.4% year-over-year through April.
Retail prices recorded the strongest performance of all property types, rising 0.7% month-over-month, its 11th consecutive month of price growth. Retail prices are up 4.2% year-over-year.
Meanwhile, Industrial properties, which were once the leading sector for price momentum during the post-pandemic period, have seen price activity continue to decelerate. Industrial properties fell 0.4% month-over-month and are just up 0.4% from one year ago.
Apartment prices similarly fell by 0.4% from March and are down 1.0% from one year earlier. Nonetheless, the annual pace of price declines for Apartment properties has been steadily easing since late 2023.
Office properties continue to gradually stabilize, with overall prices climbing 0.6% from April while remaining down by 0.3% year-over-year. Drilling down further, prices for offices in central business districts (CBDs) climbed 0.1% on the month and are down by 3.8% from one year ago. Suburban office prices rose 0.7% from March and are up by 1.0% year-over-year.
According to the report’s analysis, deal volume remains mostly on par with the same time a year ago, suggesting that price declines don’t necessarily reflect recent increases in US economic uncertainty.
3. Q1 TRANSACTION AND INVESTMENT ACTIVITY
According to Altus Group’s Q1 Commercial Real Estate (CRE) Transaction and Investment Activity Report, the US CRE market registered $69.3 billion in dollar value transacted, down from $89.2 billion in Q4 to 2024.
The total number of properties transacted also fell, declining by 11.6%, but remains above pre-pandemic levels.
According to the analysis, transaction activity showed signs of strength, with prices in the Multifamily and Office sectors climbing higher despite a relatively subdued market.
Twelve of the 15 property sub-sectors tracked by Altus Group increased in price per square foot on a quarter-over-quarter basis, with particular strength in consumer-facing categories such as big-box retail and hotels.
4. CBDS: PRICE MOMENTUM DESPITE HIGH VACANCIES
According to Commercial Edge’s latest Office Market Report, listing rates for office properties in central business districts (CBDs) continue to climb despite the persistence of high vacancies and discounted sales.
The average listing price for US office properties was $33.34 per square foot in April, the latest month of data availability, rising 5.4% year-over-year despite relatively weak demand.
The national CBD office vacancy rate stood at 12.9% in April, a 7.3 percentage point increase since 2020 as new office demand begins to favor suburban locations.
Notably, in April, President Trump signed an executive order that revoked previous directives that prioritized CBDs when selecting sites for new federal office leases. The directive, combined with the existing momentum towards suburbia in private markets, could further weaken demand in downtown areas.
According to the report, new office inventory in CBDs fell 42% year-over-year to just under four million square feet in 2024, its lowest total since 2016. Overall office inventory fell 47 to million square feet, a 10-year low, with CBD growth making up just 8.2% of the total.
5. HOUSEHOLD SPENDING GROWTH FALLS
According to the New York Fed’s Survey of Consumer Sentiment, household spending growth declined during April, the latest month available, primarily due to a decrease in large-dollar purchases.
Household spending unadjusted for inflation rose by 4.5% year-over-year through April — 10 basis points lower than the previous annual growth reading taken in December 2024. However, growth remains well above pre-pandemic levels.
The decline was driven by households earning over $100,000 per year, with the most significant spending decreases centered on large purchases, including electronics, home appliances, furniture, homes, vehicles, and vacations. Spending on home repairs rose.
6. CONSUMER CONFIDENCE IMPROVES
According to data released by the Conference Board on May 27th, US consumer confidence edged higher in May following five consecutive monthly declines.
The “Present Situation” component of the index, which measures consumers’ assessment of current business and labor market conditions, rose slightly and remains well above the recession threshold.
Meanwhile, the “Expectations Index,” which looks ahead at the short-term outlook for income and labor, surged on the month but remained within the recession-indicating range of below 80.
The Conference Board numbers diverge from the more pessimistic preliminary sentiment data released by the University of Michigan earlier in the month. Importantly, however, about half of the responses in the latest Conference Board Survey were collected after the Trump Administration’s May 12th announcement of a pause on some tariffs, illustrating a more up-to-date picture.
Nonetheless, the Conference Board notes that some of the rebound was visible in the data prior to the May 12th pause and was broad-based across all age and income groups.
7. BUILDER SENTIMENT FALLS
According to the NAHB/Wells Fargo Housing Market Index (HMI), builder sentiment fell in May to its lowest level since November 2023 and arrived well below forecasts.
The HMI, where a number over 50 indicates more builders view sales conditions as good than poor, fell six points to 34, firmly in contraction territory.
The current sales conditions index, a sub-component of the HMI, dropped eight points to 37. Meanwhile, sales expectations for the next six months fell one point to 42. The sub-component measuring the traffic of prospective buyers fell two points to 23.
34% of builders surveyed reported dropping final sales prices during May, up 29% from April and the highest share since December 2023. The average reduction for those who cut prices during May was 5%, unchanged from April.
8. HOUSING FORECLOSURE ACTIVITY
According to ATTOM’s National Foreclosure Activity Report, the US housing market continued to experience an annual increase in foreclosures during April, recording roughly 36,000 total foreclosure filings, which is a 0.4% increase from March. Foreclosure filings are up 13.9% year-over-year.
Foreclosure activity remains below historical levels, but the recent momentum reflects increased economic pressures on some homeowners.
Foreclosure starts rose 0.8% from March and are up 16.1% year-over-year. Meanwhile, completed foreclosures declined slightly month-over-month but are up 23.3% from April 2024.
On the state level, South Carolina (one in every 2,311 homes), Illinois (one in every 2,404 homes), and Florida (one in every 2,526 homes) registered the highest foreclose rates.
9. INDEPENDENT LANDLORD RENTAL PERFORMANCE
According to the Chandan Economics-Rent Redi Independent Landlord Rental Performance report, the on-time payments rate in independently operated rental units fell by 15 basis points (bps) in May, sliding to 85.5%.
April’s on-time payment rate, initially reported at 86.3%, was revised down to 85.7%. In total, the on-time payment rate has declined by 28 bps over the past two months and has fallen year-over-year for 22 consecutive months.
The forecast full-payment rate held steady at 94.6%, which is down 298 bps from the post-pandemic peak
Western states continue to hold the highest on-time payment rates in the country, led by Utah, Colorado, Washington, Idaho, and Montana.
Two- to four-family rental properties held the highest on-time payment rates in May, coming in at 86.2%. Single-family rentals (SFR) followed next with an on-time payment rate of 85.8%. Holding up the rear are multifamily properties with an average on-time collection rate of 85.1%.
10. RETAIL SALES
US Retail Sales climbed 0.1% month-over-month in April, following an upwardly revised increase of 1.7% in March, according to the latest estimates from the US Census Bureau.
April’s modest monthly gain following March’s surge suggests two things. First, March’s surge included at least some pull-forward demand, as many consumers accelerated their purchases in anticipation of tariffs and their potential price impact. Second, consumers scaled back their activity in April, either out of concern for tariffs or because they had already accelerated their purchases.
The largest monthly increases in sales were recorded in food services and drinking places (+1.2%), building materials and garden equipment dealers (+0.8%), furniture stores (0.3%), and electronics and appliance stores (0.3%).
The largest month-over-month declines were observed in sporting goods and hobby stores (-2.5%), miscellaneous retailers (-2.1%), gas stations (-0.5%), and clothing stores (-0.4%).