Many Green Street analysts’ mid-year reviews reveal rising prices across most property types, according to Michael Knott, managing director and head of U.S. The REIT study began with
The office, storage, and life science sectors did experience declines in March 2023. However, costs increased for casinos, ground leases, healthcare, strip malls, hotels, industrial buildings, and cold storage. There were rising NOIs and stable cap rates in such industries. Although listed REITs were reasonably priced when compared to bonds and inexpensive when compared to the S&P 500 (albeit given the index’s structure, keep in mind that this comparison is to a mix that is highly overweighted with technology stocks), private-market real estate was nearly 10% above its assessed fair value.
According to Vince Tibone, managing director for malls and industrial, the risk-adjusted discounted cash flow (DCF) projected return was, after various modifications, an average of 7.3%, ranging from data center at 6.9% to mall at 7.7%.
According to strip mall expert Paulina Rojas-Schmidt, the property type has recovered from the pandemic stronger, having been “revitalized” by high tenant demand and limited new supply, which has strengthened landlord bargaining power.
According to office analyst Dylan Burzinski, the private market DCF is 7.1%, ranging from 6.1% for offices to 8.4% for ground leases.
Globally, demand for data centers is surpassing supply, and this trend is likely to continue as AI deployments demand more processing power. According to David Guarino, a senior analyst for data centers and towers, the imbalance in demand will lead to new developments, with supply increasing over time.
Senior Associate for Healthcare Michael Stroyeck remarked that through the second part of the 2020s, there will be a strong demand for senior housing due to the demographic expansion of people 80 and older. Operating basics will also get better when COVID loses favor in people’s perceptions.
In the Sun Belt and coastal regions, permits are still increasing and reaching new highs, according to Alan Peterson’s analysis for residential. Low supply growth in coastal markets will guarantee revenue growth over the following 18 months. The aging population and limited purchasing power of renters will be advantageous for single-family rentals. For the next 12 to 24 months, there will be an imbalance between supply and demand, and landlords will be in a stronger negotiating position.
But not everything is positive. The sector “continues to be on shaky ground,” according to office analyst Dylan Burzinski, which isn’t surprising given the state of the economy and how businesses are navigating potential future use cases.
According to Spenser Allaway, senior analyst for net lease and self-storage, changes in real estate prices since the peak in March 2022 have been almost entirely negative, with ground lease losing 29% of its value, offices losing 27%, apartments losing 21%, malls losing 18%, and net lease losing 16% as the biggest losers. Prices are down 15% on average. Prices, however, have not always been genuinely indicative of the market due to the decline in transaction volumes.
We are ready to assist investors with Santa Ana commercial properties. For questions about Commercial Property Management, contact your Orange County commercial real estate advisors at SVN Vanguard.

Triple-net (NNN) leased retail assets have long been a point of entry into the asset class for many inexperienced commercial real estate investors. NNN retail properties are often solitary structures with one or occasionally two retail tenants, and they are typically free and clear of virtually any landlord obligations.
If there is graffiti or a roof leak, the tenant is not calling you, according to Andrew Bogardus, executive director in the net lease group at Cushman & Wakefield. You still receive a check each month while they take care of it themselves.
These assets are especially enticing in low interest rate circumstances when investors find it challenging to obtain meaningful income through other safe investment options, such as government bonds, due to their simplicity.
But what happens to the market for NNN retail properties when interest rates increase and suddenly a Dollar General in rural Louisiana’s 5% cap rate is in direct competition with a similar yield on a six-month Treasury note? And what should investors search for while examining the wide variety of NNN-leased properties on the market?
Bogardus gave LoopNet a brief overview of NNN retail assets’ fundamentals and the present competitive landscape.
Bogardus claims that smaller investors interested in NNN retail properties frequently search for a 1031 exchange possibility. They may be selling a property that requires more work, such as “a single-family home they rent out or a four-unit apartment building that they’ve been managing themselves,” and they are seeking to buy a property where they can simply “collect a check” each month.
or “mailbox money,” as Bogardus put it.
There is a NNN retail property for practically every type of investor, from banks to auto chains. Bank branches, quick service (or fast food) restaurants, automotive supply businesses, drug store chains, supermarkets, and discount retailers are some of the most typical types of retail tenants occupying these locations.
Investors that are interested in purchasing one of these assets should consider the property’s general location. Ideally, it should be near retailers that complement it in a high-traffic, high-visibility area. Even among those tenants, there is a hierarchy. Big-name, national shops often attract the most investor interest and are provided at the lowest cap rates. According to Bogardus, trendier and more well-liked customers, like Chick-fil-A or In-N-Out Burger, will command more attention and higher pricing than their less well-liked siblings (like Arby’s or Sonic Drive-In).
The normal length of a lease for a NNN retail property is between 10 and 20 years, with yearly increments. However, investors should be aware of how much time is remaining on the lease because, according to Bogardus, the more time left on the lease, the more desirable the property will typically be.
Who signs the lease is another issue that needs to be addressed., Bogardus asked rhetorically. Investors should be aware of whether their potential property is leased to a corporately owned store or a franchisee, according to Bogardus. Corporate-owned properties are seen as preferred due to their good credit standing.
For NNN retail investors, it is crucial to comprehend the stability of the current tenant because the only obligation building owners have is to lease the property once more in the event that the current tenant vacates the premises.
The Present Retail NNN Lease Property Market
As one might anticipate, the market for NNN lease properties has been significantly impacted by the rise in interest rates, which has increased the yield on a variety of safe investment options.
Since early September [2022], “we’ve seen demand fall off significantly,” Bogardus added. It has moved much more slowly.
According to Bogardus, investors might anticipate getting a loan for a NNN retail property in the region of 3%–3.5% prior to the increase in interest rates. However, the cost of debt has increased significantly and quickly in the current environment, and investors are now looking at interest rates between 5.75% and 6.25%.
Bogardus emphasized that in order to maintain the same cash-on-cash return, the cap rate must increase.
But strangely, cap rates on NNN retail assets have remained unchanged. According to Bogardus, the majority of institutional investors are currently looking for cap rates on these properties between 6% and 6.5%, although sellers are still committed to obtaining cap rates of approximately 5%.
“We have a big disconnect,” Bogardus remarked.
This discrepancy is typical of a situation that has been occurring in the real estate market across asset classes and regions, where sellers have been hesitant to give in to the current interest rate environment and recognize the effect it has had on cap rates.
The effects of that difference may be felt even more sharply in the NNN market because most NNN buyers are more focused on attaining a stable, consistent return than they are on long-term appreciation or potential future upside. The largest threat to profitse an unexpected vacancye still exists, so why incur the risk when a similar return can be obtained through other means? NNN retail buildings unquestionably present owners with fewer hazards than many other real estate investments.
Nevertheless, Bogardus thinks that cap rates will eventually catch up to interest rates. Sellers can determine where they need to be with the cap rate once interest rates stabilize.
Until then, Bogardus emphasized that the 1031 exchange market for buyers of NNN investments is still highly active. They are attempting to purchase a property with a long-term lease and a national tenant in order to delay paying taxes.
Additionally, he noted that the sites inhabited by the more well-known and reliable retailers listed earlier continue to have robust business. The cap rates must increase if the shop, though, “doesn’t have as good of a reputation, or perhaps it’s a franchisee instead of a corporate-owned store.”
Commercial real estate has continued to test its speed limit on the path to normalcy through mid-2022. Though coming off 2021 highs, price momentum in the sector has sustained throughout the first half of 2022, generally following deal volume activity over the same period. The Industrial sector continues to lead the post-COVID hierarchy, pushed by a prolonged shift in warehouse demand as goods inventories pile up amid complex supply chain and consumer demand dynamics. The Multifamily/Apartment sector is close behind, benefiting from robust demand that has only intensified in recent
months as homebuying becomes increasingly unaffordable for many would-be buyers. Meanwhile, the Office sector continues to lag behind its peers as space demand settles at a new post-pandemic low, driven by remote work adoption. The Retail sector, despite a slow start to begin the recovery, achieved record annual price growth in Q1 2022, which coincided with a seven-year high in deal volume. In this commercial real estate mid-year update, the SVN | Research team explores MSCI Real Capital Analytics (MSCI RCA) data on transaction volume, pricing, and cap rates, comparing current trends to ones observed before and during the onset of the pandemic.1
Through July, measured by MSCI RCA’s Commercial Property Price Index (CPPI), commercial real estate prices have risen by 16.8% from one year ago. The latest figures are just a tad under the record 19.9% pace that was registered earlier this year and reflect an industry that continues to be a bright spot amid a storm of economic headwinds. Properties that are located both inside and outside of gateway metros have moderately slowed in recent months but have shown the ability to absorb the early effects of monetary tightening, climbing by 8.9 % and 19.3% year-over-year, respectively, through July.
Growth in gateway markets has consistently trailed non-gateway metros throughout the pandemic recovery, as corporate America inched its way into a new normal within larger cities. Somewhat surprisingly, the divergence only intensified as the United States moved beyond COVID-era policies and activity restrictions.
The growth spread between non-gateway metros and the top six major metros was relatively unchanged between December 2020 and July 2021 but began to balloon as the Delta variant took hold in the Fall. As Delta subsided to start

2022, inflation in the US intensified, with non-major metros experiencing a higher degree of cost increases relative to larger cities. So-to did the growth spread between gateway and non-gateway metros, which swelled to 10.43% through July 2022 — more than double its growth spread from one year ago.
The variation between gateway and non-gateway inflation rates likely explains a significant part of why we are seeing a similar pattern among commercial real estate price growth.
The Apartment market continues to be a stalwart not only for commercial real estate but for the US economy at large. According to MSCI RCA, Apartment transactions rose by $18 Billion from Q1 to Q2 2022, a 26% increase quarter-over quarter and up 42% from one year ago.
While transaction volume in the sector has receded from the record highs achieved in 2021, it continues to benefit from robust housing demand amid increasingly limited supply. If Apartment sector volume were to continue its pace set during the first half of this year, it would amount to more than $309 billion in sales, second only to 2021’s record level.

Through Q2 2022, unit prices are up 25.6% year-over-year — an all-time high for the sector. Amid rising prices and increased buyer activity, cap rates have continued to fall to new lows, dropping 10 bps to 4.3% in Q2. Between 2011 and 2019, a rough approximation for the last real estate cycle, cap rates fell an average of 17 basis points annually. According to the latest data, cap rates are down by a weighty half-percentage point from one year ago.
Transaction volume in the Office sector continues to trail pre-pandemic levels as remote work gains what signals to be a permanent foothold in the US labor market. Through the second quarter of the year, MSCI Real Capital Analytics has tracked $57.7 billion worth of Office sales, an improvement from the same period in 2021, but roughly $10 billion below
the first-half 2019 pace.
Projecting out the half-year data over the rest of 2022, the annualized total of $115.4 billion would amount to just 80% of both 2021 and 2019 volumes. However, it is worth noting that transaction volumes across most property types tend to peak in the fourth quarter — in the five years before COVID, CRE transaction volume was 22% higher on average during the second half of the year compared to the first. The seasonality was exacerbated in Q4 2021 as inventors readied for the impending Fed tightening cycle — Office sector transactions achieved near record-volume in Q4 2021 ($56.6 billion).
The trend suggests that 2022’s first-half improvement over last year may be a more reliable signal than the annualized projection. Still, as 2021 ended, Office investors still largely anticipated a normalization of attendance levels as pandemic era activity patterns waned. So far in 2022, all evidence has pointed to the contrary, and Office transaction volumes are likely to stall in the fourth quarter of 2022 compared to previous years as a result.

Entering the pandemic, office space on average was transacting at $238 per square foot. Pricing fell to a low of $235 per square foot between Q2 and Q4 2020 and has since rebounded to new highs — reaching $278 per square foot in Q2 2022. As of Q2 2022, office space is transacting at an average of $289 per square foot, up 13.3% year-over-year and 2.2% quarter-over-quarter. Cap rates on Office properties continue to reach historical lows, falling to 6.0% in Q2 2022. Over the past year, cap rate compression in suburban offices has driven much of the reduction in the broader sector.
The Retail sector has shaken off early pandemic headwinds, registering its highest first-half of the year transaction volume since 2015. Further, through the second quarter of 2022, Retail led all sectors with a 46% year-over-year increase in deal volume. Notably, compared to other CRE types and their sub-sectors, Retail has experienced the largest variation in sales growth between its two sub-sectors over the past 12 months. Transaction volume at shopping centers rose 186% year-over-year through Q2 2022, while shop sales rose just 52%.
Though annual growth has fallen below the triple-digit increases seen throughout 2021, much of last year’s high marks were due to base effects stemming from an anemic market in 2020. If Retail volume was to continue at its current pace for the remainder of the year, it would set a record $89.2 billion in transaction volume. Considering that this projection does not factor in the typical volume uptick during the fourth quarter, Retail is poised have a banner year in 2022, all else held constant.

Retail cap rates ticked down 10 bps quarter-over-quarter to a new all-time low of 6.0% in Q2 2022. While cap rates in the sector held relatively steady throughout much of the pandemic, they have fallen by 40 basis points over the past year as property values have risen more rapidly than rents. Retail price per square foot reached $313 in the second quarter, the highest mark on record.
Moreover, the price per square foot for transacted Retail assets has risen on a year-over-year basis for five consecutive quarters. Prior to the recent string of price growth, annual pricing had declined for four consecutive quarters. Through Q2 2022, Retail price per square is up 24.9% year-over-year, the fastest annual pace on record.
The Industrial sector has seemingly had the wind at its back ever since the end of the Great Recession, and this was only intensified by the positive shift in goods consumption that we saw take place during the pandemic. Through the halfway mark in 2022, sector growth remains as strong as ever. According to MSCI Real Capital Analytics, $74.9 billion of Industrial asset sales have changed hands through the first two quarters of 2022, amounting to 134% of 2021’s first half volume. Annualizing the first two quarters of sales suggests that the sector is on pace to hit $149.2 billion worth of
transaction volume by the end of the year.
Like the pattern evident across all CRE sub-sectors, Industrial transaction volumes could accelerate during the second half of the year. For instance, in Q4 2021 Industrial transaction volume totaled a massive $77.3 billion, roughly $20 billion more than the first two quarters of 2021 combined. While last year’s market was partially fueled by monetary policy tea leaves, if Industrial experiences an uptick in Q4 2022 that is anywhere close to what we saw last year, the sector will set an annual total that is well ahead of what it has to date.

Like all other sectors, cap rates for the Industrial sector continue to chart new lows, falling 10 bps quarter-over-quarter and 40 bps year-over-year. On the other hand, asset pricing continues to reach record highs both in terms of observed levels and annual growth rates. As of Q2 2022, Industrial assets are trading at an average of $175 per square foot, rising $8 from the previous quarter and $32 from one year ago. Through the second quarter, asset price growth in the sector has achieved a new record high of 32.0% year-over-year first achieved in Q1.
The US economy is sending mixed signals, to say the least. Inflation continues to sit near generational highs, with the Consumer Price Index (CPI) climbing by 8.5% over the previous 12 months through July. A flattening of headline CPI between June and July has escalated hopes that the Federal Reserve’s monetary tightening may be having an impact on price pressures. Still, Fed Chair Jerome Powell along with several other FOMC voting members have indicated in recent statements a willingness to push ahead with hikes until the economy has achieved a sustained reduction in price growth.
The feared double-edged sword of rising rates has indeed begun to poke out in both directions. Real GDP declined by an annualized 0.6% in Q2 2022, according to the latest estimate released by the Bureau of Economic Analysis (BEA) in August, the second consecutive quarterly reduction. A fall in private inventory investment, residential fixed investment, federal government spending, state and local government spending, and nonresidential fixed investment over the quarter fueled the decline. Notwithstanding, consumer spending remains robust while US exports increased in the second quarter. That sustained economic activity is evident in the continued strength of the labor market, which added 528,000 jobs in July as the unemployment rate ticked down to 3.5%.
Whereas in 2020 and 2021, commercial real estate success was propelled by unprecedented economic stimulus followed by a momentous reopening of the economy, it is now being fueled both by late-cycle demand and the cascading of costs related to supply shortages. The above can be inferred because, while each major sector besides Office saw an annual transaction volume climb through Q2 2022, all four sectors saw a decline in the numbers of properties transacted. Builders have sounded the alarm for months on the challenges brought by labor and materials shortages that are hampering their ability to complete new projects. These added costs amid the backdrop of sustained demand are adding significant value to assets.
Each sector of CRE will have its own key factors to look out for as we progress through the second half of 2022. Apartment assets should continue to benefit from consumers trickling out of the home buying market and into the rental market. New home sales fell sharply in July, down -12.6% month-over-month and -29.6% year-over-year. Much of the would-be housing demand will overflow into apartments, but tenant affordability concerns will likely intensify. The fate of Industrial assets will largely depend on Retail inventory volume in the coming months. Retail inventories excluding autos increased by 1.5% in July, according to the Census Bureau, as pent-up orders from earlier in the year get stocked away. However, many Retail market watchers expect record discounting this holiday season as firms look to reduce inventory — an important signal to keep an eye on.
Office appears to be settling into a new post-COVID equilibrium, but one where quality, accessibility, and amenities are arising as key differentiators for space demand relative to centrality. Retail has enjoyed a sizeable rebound so far this year, and where consumer spending evolves from now will be a key barometer for the look ahead. While many consumers remain skittish about inflation and are enduring tough spending decisions in each paycheck, consumer sentiment has begun to rebound from its historic low reached in June. Even with a few traffic jams along the way, commercial real estate and the US economy as a whole are still moving forward with pace.
On July 6th, the Federal Reserve’s Federal Open Market Committee (FOMC) minutes from its June meeting were made public, and they contained some fascinating information for the real estate sector.
The first was a direct reference to bank lending for commercial real estate:
“Commercial and industrial (C&I) and commercial real estate (CRE) loans on banks’ balance sheets expanded at a rapid pace in April and May. Issuance of both agency and non-agency commercial mortgage-backed securities (CMBS) stepped down slightly in May from its strong pace earlier in the year. Small business loan originations through April were in line with pre-pandemic levels and indicated that credit appeared to be available.”
For a majority of borrowers, residential mortgage credit was “widely available” through the month of May, however independent of the Fed’s observations, persistently increasing rates are discouraging most borrowers. According to information from the Mortgage Bankers Association that Trading Economics has compiled since January, there have been twice as many weeks in which the number of mortgage applications fell in contrast to weeks in which numbers of mortgage applications showed increasing numbers.
The minutes stated that “While refinance volumes continued trending lower in April and May amid higher mortgage rates, outstanding balances of home equity lines of credit at commercial banks posted the first significant increase in more than a decade, likely reflecting a substitution by homeowners away from cash-out refinances.” Bank interest rates for C&I and CRE loans have climbed, and yields on non-financial business bonds are far above pre-COVID levels.
According to Alex Killick, managing director at CWCapital, “Commercial real estate has historically been a hedge against inflation, and we continue to see sturdy rent growth in the multifamily and hotel sectors.” That being said, Killick noted that cost inflation, notably for staffing and insurance, is impacting NOI margins, particularly on office and retail properties where tenants are on long-term fixed rent leases with escalations of 2% to 3% annually, below the rate of expense inflation.
Killick also states, based on Fed notes and plateauing trends of some commodity prices, looming fixed rate loan maturities in 2023 and 2024 represent “the biggest near-term risk in CMBS,” with projected refinancing charges between 1 and 2 percentage points higher than current rates. Where NOI has also been influenced by rising expenses, may go through a level of distress that is greater than anything we haven’t experienced prior to the 2020 COVID default wave,” he adds.
Al Lord, CEO of Lexerd Capital Management, which largely focuses on multifamily – what he claims is a present bright spot. Lord says interest rate increases would negatively influence financing costs of commercial real estate projects and on the margin, we anticipate some projects to be canceled. The demand for rental housing is so robust that, despite increases in the cost of financing MF real estate projects, this asset class is predicted to do well for investors through at least 2023.
According to one market observer, investors “shouldn’t be concerned of an oncoming recession” and instead should think about the economic outlook over the next 3, 5, and 10 years.
Because there are so many different economic crosscurrents at play, it’s difficult to predict whether and when the next recession will occur. According to John Chang of Marcus & Millichap, these factors make it very hard to anticipate a recession, and even while “the risks are mounting,” a recession is not a given.
On the one hand, according to Chang, job growth is strong, with 488,000 new positions added each month on average this year. 3.6 percent is the current unemployment rate, and 5.2 percent is a significant pay growth rate. Additionally, despite recent stagnation in retail sales, they are still growing by almost 8%.
According to Chang, ” “Those are all positive economic readings pointing to a steady growth outlook.” Chang also notes that on the other hand, we have rising interest rates, a declining stock market, a record-high inflation rate of 8.5 percent, and declining confidence levels. There is in many respects a fear element at play that can force individuals to cut back on their spending and bring about a recession.
Therefore, is it really important if the US experiences a recession? Chang says it depends on the situation.
Chang claims that the current situation is unlikely to experience the liquidity shortage that the Great Financial Crisis did, which limited real estate investment. Although there are many different reasons and repercussions for recessions, Chang believes the US is likely to see one similar to that of the 1981 or 1990 downturns. Strong growth and rising inflation in the years before both of these periods influenced the Fed to raise interest rates aggressively, as we are seeing today. Chang observed significant variation among property types, with apartments, for example, holding up well in the 1980s and dipping mildly negative in 1991 – though “nothing like the hit the sector took in 2009,” he says. Yields softened in both recessions, but not to the extent of the decline in 2009.
The location and asset will determine a large portion of the risk to CRE investors. However, according to Chang, “in general, real estate has generated good returns through most recessions.” “And even when returns fell, there was typically strong, steady growth in its wake. Therefore, yes, economic downturns do affect commercial real estate, but not nearly as much as we may think.
We are ready to assist investors with Santa Ana commercial properties. For questions about Commercial Property Management, contact your Orange County commercial real estate advisors at SVN Vanguard.
THE RETAIL SECTOR was already steeped in transformational shakeout prior to the pandemic, rightsizing to how shopping is done in an increasingly digital economy. In what has already been a decade-long process, most analysts thought it would be a decade more before we started to see a turnaround. Of course, the pandemic has updated those timelines dramatically. SVN® Retail Product Chair Ryan Imbrie, CCIM notes that the retail sector “landed on the unfavorable side of COVID-19’s lopsided impact on commercial real estate.” While industrial properties benefited from the surge in online spending, Imbrie says the pandemic advanced the retail sector’s “long slide” with mounting store closings and rising vacancy.
As the old Winston Churchill quote goes, “If you’re going through hell, keep going.” In 2020, with physical restrictions on retail in place, a significant portion of retailing shifted from in-person to online. E-commerce’s share of retail sales has grown by an average of 0.5 percentage points annually since the start of the millennium, but between Q1 and Q2 2020, it shot up from 11.4% to 15.7%1— quantitative proof that Americans were not only buying toilet paper and DIY arts and crafts during the shutdown. Thankfully for the Retail sector, shoppers returned to the aisles in late 2020 and continued doing so throughout 2021. Through Q4 2021, e-commerce’s share of retail sales has fallen down to 12.9%.2
Overall, monthly retail sales reached their highest level on record in January 2022, coming in at a seasonally adjusted $650 billion for the month.3 The sector “has experienced some bright spots where tenants are thriving as seen in grocery-anchored properties, home improvement, and dollar stores,” remarks Mr. Imbrie. Over the short term, the sector should continue to benefit from an apparent shift away from services and towards the consumption of physical goods that have remained present even as the country has lifted most pandemic-era restrictions.

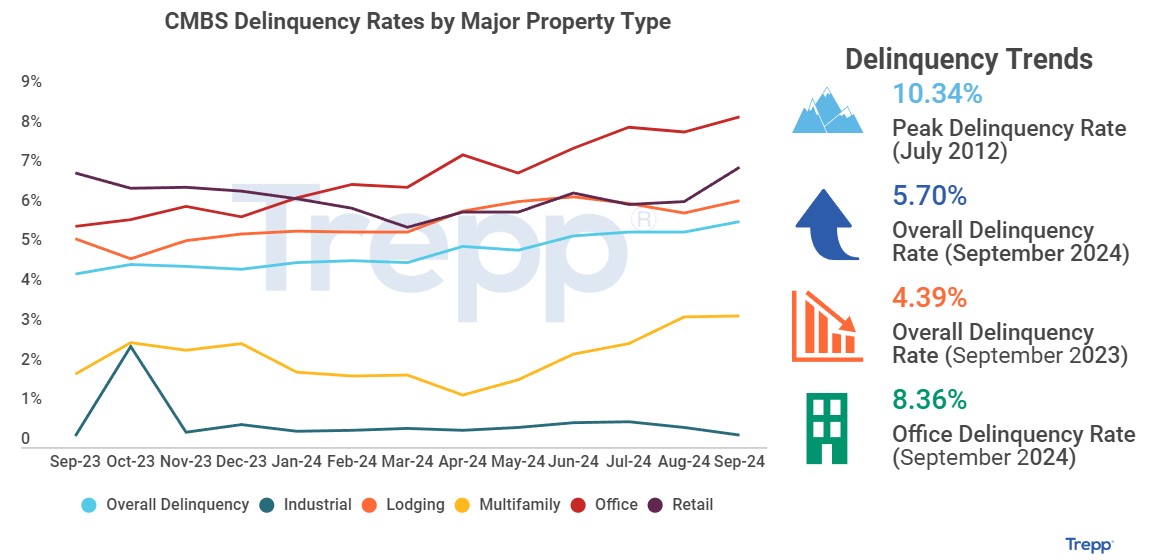
The Retail sector was often compared to a patient on life support heading into the pandemic, and the shock of the shutdown was widely thought to be a knockout blow. Interventions by the Federal Government, namely the Payroll Protection Program, helped to limit the scale of distress. According to Trepp, levels of distress in the sector continue to improve, though investors remain cautious. Through January 2022, the CMBS delinquency rate has improved to 8% — down from 18% during the pandemic’s crisis peak, though still above the sub-4% level where it was entering 2020.4

Still, for the first time in a long time, having a healthy dose of optimism for the Retail sector feels appropriate. According to OpenTable’s COVID recovery tracking, the US is arriving right back at its pre-pandemic benchmark for restaurant reservations almost two years after the initial shut down. Moreover, after adjusting for inflation, the value of new commercial construction put in place, a broad category that includes most retail and wholesaling activities, has trended downward since 2018. With less new supply entering the Retail sector, the macro task of repositioning existing stock becomes a bit less herculean. Retail may not be out of the woods just yet, but after following Mr. Churchill’s advice, the temperature dial is starting to improve.

Transaction volumes in the retail sector surged in 2021, following a trend observed throughout all commercial real estate. According to Real Capital Analytics, deal volume for retail assets reached $76.8 billion last year — an 88% improvement from 2020’s pandemic-muted total and 14.1% better than 2019’s mark.5 While new deal activity in 2021 remained down from 2015’s record peak by $13.5 billion, last year saw the most retail deal volume since 2018.6
As was the case in 2020, the Retail sector was a mixed bag of outcomes across its sub-property types. Big Box Retail assets saw a resurgence as new deal activity rose by 88% to $2.6B — roughly equivalent to 2019’s and 2020’s totals combined.7 Lifestyle/Power Centers also saw a large uptick in 2021, posting $5.8 billion of deal volume, marking its highest total since 2014.8 Mall assets have continued to see deal volumes crater as the maligned product type posted just $1.9 billion of trades last year, declining 51% from 2020.9 Drug store assets saw muted growth in 2021 as deal volume grew year-over-year by just 19%.10 However, Drug Store’s lackluster (by comparison) growth total is a function of the product type’s success in 2020, as it was the only asset type seeing investment growth during the pandemic slowdown.
Cap rates for Retail properties continued to post declines in 2021. Through Q4 2021, cap rates are down 6 bps from Q3 and 20 bps from the same time last year.11 Again, retail sub-types saw dramatically idiosyncratic cap rate movements through 2021. Unsurprisingly, Malls were the only sub-asset type to post rising property yields in 2021, growing 47 bps year-over-year through Q4 2021.12 Grocery-anchored followed next, with the property type posting just 11 bps of cap rate compression last year.13 On the other side of the spectrum are Anchored and Big Box retail assets, which posted cap rate compression totals in 2021 of 42 bps and 49 bps, respectively.14
On the pricing front, retail assets across the board saw improving trading valuations in 2021. The average year-over-year price appreciation for all retail assets through Q4 2021 was 24.7%.15 Moreover, retail assets generally are trading at valuations 19.0% above where they stood pre-pandemic and 18.1% above their previous all-time high (2016).16 The best performing retail sub-types by price appreciation in 2021 were Centers and Unanchored assets, which saw valuations grow by 30.5% and 22.6%, respectively.17

From the coastlines of Florida to the outskirts of the Colorado River, the retail sector in the Sun Belt is cashing in on consumers migrating into the Southern portion of the country. Positive momentum is stretching across state lines and time zones. Nashville closed out 2021 as one of the nation’s top-performing retail markets, posting the third-highest annual rent growth totals (8.4%).18 While Nashville is heralded as the music capital of the country, its tech sector is singing the sweetest tunes of all. Nashville’s expanding tech base is forecast to double the metro’s employment growth rate in the coming years,19 bringing more residents into the area and putting additional upward pressure on available space. Las Vegas, another entertainment industry heavyweight that has cultivated its tech sector, is experiencing a similar trajectory of success. Retail market rents in Sin City finished up 10.0% to close out 2021, the top mark in the country.20
Three of the four largest increases in Retail occupancy last year were found in the Sun Belt — two of which were in Florida.21 Baton Rouge, LA led the entire country with the largest one-year occupancy rate increase.22 Between Q4 2020 and Q4 2021, occupancy rates in
Baton Rouge jumped from 91.4% to an extremely tight 96.8% — an improvement of 5.4 percentage points.23 Moving down the list, Daytona Beach, FL, posted an occupancy rate improvement of 1.9 percentage points, and Fort Myers, FL, rose by 1.4 percentage points.24 Commenting on the Daytona Beach and Ormond Beach area, Carl Lentz of SVN | Alliance Commercial Real Estate Advisors notes that “explosive residential growth and retail traction along the LPGA corridor have been the primary drivers of the momentum.” While warm winters are a consistent selling point throughout the Sunshine State, Daytona’s retail sector has also benefited from its proximity to the region’s booming blend of suburban amenities, a dominating feature of post-pandemic real-estate growth.
Mr. Lentz goes on to mention that “as local and regional retailers continue to see success, many national retailers are paying attention and entering the market.”

The US economy has experienced a robust recovery from the initial shock of COVID-19. A pandemic-driven shift in consumption away from services and into goods, boosted by a sweeping stimulus effort, reconditioned our economy well before an off-ramp from the public health crisis was in sight. By Q3 2020, inflation-adjusted GDP shrugged off its worst quarterly performance on record to record its best, a 33.4% annualized growth rate.1 In 2021, the total nominal value of all consumption and production reached $23.0 trillion, a 9.1% increase above 2020’s total and 6.9% above 2019’s total. After adjusting for inflation, the US economy is 3.2% larger than its pre-pandemic peak.2
The foundation of the economy’s rebound has been a swift labor market recovery. At its April 2020 peak, the official unemployment total reached a staggering 23 million people.3 By the start of 2021, the unemployment total had improved to just 10.1 million people out of work.4 Over the past year, this level has come down to 6.5 million people, less than one million above the pre-pandemic level of 5.7 million.5

One year ago, the market consensus was that the Federal Open Market Committee (FOMC) would not begin a monetary policy tightening cycle until 2023. However, as demand surges in the face of gummed-up supply chains, rampant inflation has emerged at center stage, forcing shifting guidance from policymakers.
After decades of tepid price increases, in January 2022, the Consumer Price Index (CPI) reached 7.5%, a level not seen in 40 years.6 Core-PCE, the Federal Reserve’s preferred inflation gauge that excludes food and energy prices, reached 5.2% in January, prompting the FOMC to be increasingly committed to an interest-rate hike at its March 2022 meeting.7 In just 24 months, policymakers at the Federal Reserve have repositioned themselves from a tighter monetary policy stance into an accommodative one and back to a tightening one. According to the CME Fed Watch Tool, as of February 23rd, future markets are forecasting seven rate hikes by the end of the year — a sizable shift from even just one month earlier, when future markets were forecasting just four rate hikes in 2022. Volatile swings in the medium-term outlook are symptomatic of the rapid shifts in economic activity that categorized the past two years.
In December, Fed officials looked on cautiously at the near-term outlook as Omicron emerged as a roadblock to economic normalcy. After the Delta variant led to declining activity and sluggish job growth in mid-to-late summer 2021, some officials worried that Omicron, a more transmissible variant of COVID compared to previous waves, would hinder the recovery. While a significant wave of US cases followed, the Omicron wave proved to be less deadly and less straining on the US public health system than previous ones. As a result, an increasing number of US states and municipalities are relaxing masking and vaccine restrictions. On February 25th, the CDC introduced a new slate of guidelines that experts say shifts the US into the “endemic phase” of the pandemic. The new guidelines would put more than half of US counties and over 70% of the population in “low” or “medium” risk designations, bolstering the FOMC’s willingness to remove accommodative monetary policies.

Still, a measurable dose of uncertainty overhangs stock markets and the whole macroeconomy. The VIX, a volatility index captured by the Chicago Board Options Exchange, has remained stubbornly elevated since the onset of the pandemic. Despite moderately retracting during the fall of 2021, the annual average for the VIX in 2021 was 19.7, 27.7% above its 2019 average.8

The SVN Vanguard team can help with your retail real estate needs. We can help you find the ideal retail property for sale or lease. Interested in discussing a sale-leaseback? Contact us.
NATIONAL OVERVIEW SOURCES
- US Census Bureau
- US Census Bureau
- US Census Bureau
- https://www.trepp.com/hubfs/Trepp%20Retail%20Report%20February%202022.pdf?hsCtaTracking=8cec15d8-2d6d-4a7e-b3be-47518c19f0f8%7C7edd6f4f-a67b-476b-aaec-43ab495ce73c
- Real Capital Analytics; Through Q4 2021
- Real Capital Analytics; Through Q4 2021
- Real Capital Analytics; Through Q4 2021
- Real Capital Analytics; Through Q4 2021
- Real Capital Analytics; Through Q4 2021
- Real Capital Analytics; Through Q4 202
- Real Capital Analytics; Throughout Q4 2021
- Real Capital Analytics; Throughout Q4 2021
- Real Capital Analytics; Throughout Q4 2021
- Real Capital Analytics; Throughout Q4 2021
- Real Capital Analytics; Throughout Q4 2021
- Real Capital Analytics; Throughout Q4 2021
- Real Capital Analytics; Throughout Q4 2021
- CoStar; Through Q4 2021. Note: Measured across the top-100 markets
- https://technologycouncil.com/wp-content/uploads/2021/11/2021-State-of-Middle-TN-Tech.pdf?utm_source=Sailthru&utm_medium=email&utm_campaign=2021.11.22%20NASH&utm_term=NASHtoday%20Subscribers%20-%20MASTER
- CoStar; Through Q4 2021. Note: Measured across the top-100 markets
- CoStar; Through Q4 2021. Note: Measured across the top-100 markets
- CoStar; Through Q4 2021. Note: Measured across the top-100 markets
- CoStar; Through Q4 2021. Note: Measured across the top-100 markets
- CoStar; Through Q4 2021. Note: Measured across the top-100 markets
MACRO ECONOMY SECTION SOURCES
- US Bureau Economic Analysis
- US Bureau Economic Analysis
- US Bureau Labor Statistics
- US Bureau Labor Statistics
- US Bureau Labor Statistics
- US Bureau Labor Statistics
- US Bureau of Economic Analysis
- Chicago Board Options Exchange
By FNRP Editor | February 9th, 2022
The goal of every commercial real estate investment is the same, to earn a return on invested capital. Typically, this is achieved by purchasing an investment property at a good price, earning a stream of income over a defined holding period, and then (hopefully) selling the property for more than the purchase price. In order for the property to sell for more than the purchase price, it must experience price appreciation.
In this article, we are going to explore the relationship between a rental property’s cap rate and price appreciation. To do so, we will define what a cap rate is, describe how it is calculated, and identify how changes in it contribute to price appreciation. By the end, readers will be able to use this knowledge to evaluate the appreciation potential with commercial real estate investment opportunities.
In order to understand the relationship between cap rates and price appreciation, it makes sense to start by defining exactly what a cap rate is.
In commercial real estate investment, a property’s cap rate is a performance metric that describes the relationship between its net operating income (NOI) and its market value. The cap rate formula is:
Cap Rate = Net Operating Income / Property Value
In this equation, NOI is calculated as a property’s gross income minus operating expenses, and property value is derived from the purchase price, estimate, or appraisal. The result is a percentage that provides real estate investors with two key pieces of information:
Because the cap rate measures risk and return, there is a direct relationship between it and how much the price of a property appreciates.
The concept of commercial real estate appreciation is a simple one. It means that the value of the property rises over the course of the holding period. It can be measured over different time intervals but is most commonly measured as the change between the purchase price and the sales price. For example, if a property is purchased for $100,000 and sold for $125,000, it “appreciated” in value by $25,000.
Generally, there are three ways that a property can experience price appreciation: through cap rate changes, through efficient management practices, or both.
When evaluating a property’s market, real estate investors are well served to choose one whose conditions are favorable for “cap rate compression.” In this scenario, market factors – like supply, demand, population growth, and rental rates – converge to convince investors that it is worthwhile to pay higher prices for a property, which is reflected in a lower cap rate.
For example, assume that a property with $100,000 in NOI was purchased at a 7% cap rate or $1.42MM. Also assume that five years after purchase, demand in the market has risen significantly. Population and job growth is high and investors are clamoring for properties. As a result, cap rates have fallen to 6%. Assuming the property has the same $100,000 in NOI, the new value at a 6% cap rate is $1.66M. In this scenario, market dynamics have driven cap rates lower and caused $240M in price appreciation.
Now assume that the same property with $100,000 in NOI was purchased at a 7% cap rate or $1.42MM. But, over the course of five years, the property owner has managed expenses, renegotiated some lease rates, and developed new streams of ancillary income. As a result, NOI has increased $125,000. Assuming the cap rate stays the same, the new value is $1.78MM, which is $360,000 higher than the purchase price.
The above examples are for illustrative purposes only. In reality, both NOI and the cap rate change over the term of the holding period. In an ideal real estate investing scenario, market forces drive cap rates lower, and efficient management practices drive NOI higher.
If a property with $100,000 in NOI is purchased at a 7% cap rate, the price is $1.42MM. Now, assume that NOI rises to $125,000 and cap rates fall to 6%. The new value is $2.08MM, which is $660M higher than the purchaser’s price. This is the scenario that offers the highest price appreciation potential/return on investment. It is also the one that real estate investors are after when they acquire a property.
A property’s capitalization rate is a performance metric that describes the relationship between its net operating income and its value.
The result of the cap rate calculation provides real estate investors with an idea of their potential annual return if the property was purchased with cash. In addition, it gives them an idea of the market’s assessment of the property’s risk level.
There is a direct relationship between a property’s level of price appreciation and its cap rate. When market dynamics are strong, cap rates are pushed lower, which causes the valuation to rise. Conversely, if market conditions are poor, cap rates rise and the value of the property is pushed lower.
The other way a property can appreciate in value, assuming the cap rate remains the same, is to increase the amount of net operating income that a property produces. Typically, this is accomplished through efficient management practices.
In an ideal scenario, market conditions drive cap rates down at the same time that efficient property management drives net operating income up. This is where the greatest price appreciation is achieved.
Originally posted on FirstNationalRealtyPartners
We are ready to assist investors. For questions about Commercial Real Estate Investment and Commercial Property Management, contact your Orange County commercial real estate advisors at SVN Vanguard.
