1. GDP
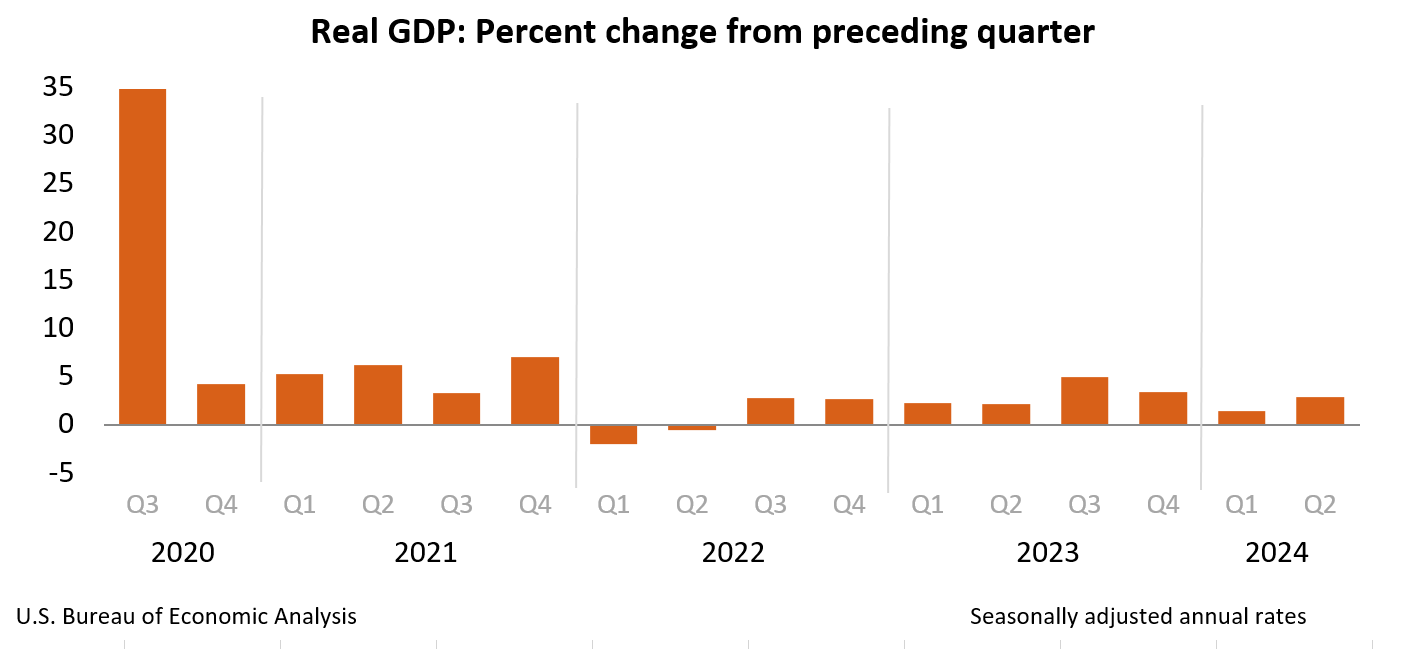
- According to the Bureau of Economic Analysis, the US economy expanded at an annualized rate of 2.8% in the second quarter, up from 1.4% in the first quarter and above the consensus forecasts of 2%.
- Consumer spending accelerated from the first quarter, climbing from a 1.5% annualized rate to 2.3%. Goods consumption spurred the rebound, which rose at a rate of 2.5% in Q2 after falling at an annualized rate of -2.3% in the first quarter. Motor vehicles, recreational goods and vehicles, and gasoline led growth in goods consumption while services slowed from a rate of 3.3% last quarter of 2.2%.
- Notably, private inventories contributed positively to consumption during the quarter after being a drag on it during the last two quarters.
- Residential investment contracted for the first time in a year while non-residential investment accelerated from a 4.4% rate to 5.2%, led by equipment, which grew at more than eight times the rate in the first quarter.
- Government spending accelerated in Q2, led by defense, while net trade continues to drag down growth as imports rose faster than exports.
2. BEIGE BOOK
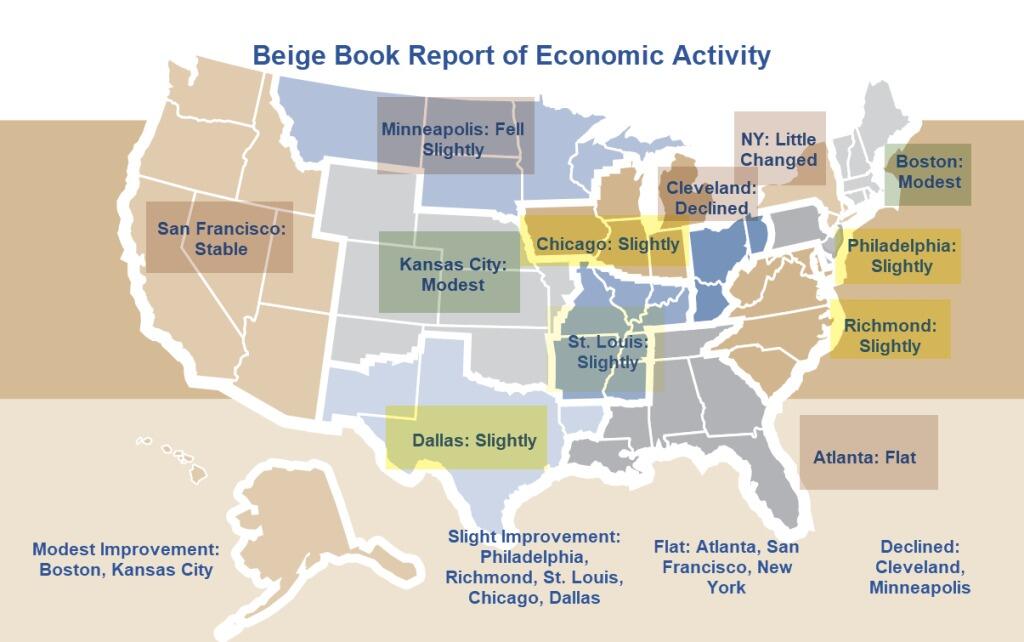
- The Federal Reserve’s Beige Book summary of economic activity reported that in the six weeks ending on July 17th, the US economy grew at a slight to modest pace in most districts, but five of the twelve districts reported flat or declining activity.
- The data reflects activity that is also captured in this week’s second-quarter GDP estimate but offers an under-the-hood snapshot of the US economy’s regional differences, labor market activity, and economic sentiment.
- While the advanced estimate of second-quarter GDP released on Thursday reported an acceleration from the previous quarter, the five districts reporting flat or declining activity in the most recent Beige Book also accelerated— three more than the last report.
- Wages continue to grow at a modest to moderate pace in most districts, the Fed reports. Prices also rose modestly, while household spending was little changed. The interactions of these three metric trends over the next several weeks will play a critical role in determining whether policymakers move forward with a widely expected September interest rate cut.
- Many districts noted softer demand for consumer and business loans while reported activity on residential and commercial real estate markets varied. Travel and tourism were roughly on par with seasonal expectations, and a retail inventory buildup spurred notable growth in the transportation sector.
- Expectations for the six months ahead forecasted slower economic growth stemming from uncertainty around the US election, domestic policy, geopolitical conflict, and inflation.
3. INTEREST RATE FORECAST
- The stronger than expected second quarter GDP report shifted market expectations for number of rate cuts that will take place in 2024, though expectations for the timing of the first rate cut have largely held.
- According to the Chicago Mercantile Exchanges Fed Watch Tool, there is still an 88.2% chance of a September rate cut, down from 92.0% one week ago.
- On the day before the Q2 GDP report, futures markets projected a 52.7% change that there would by three quarter-percentage point rate cuts by the end of year. However, by the end of the trading day on Thursday, an overwhelming 87.7% forecast the policymakers will hold rates steady through the end of the year following an initial cut in September.
4. MID-YEAR COMMERCIAL PROPERTY OUTLOOK
- A recent mid-year report from Capital Economics forecasts that transaction activity is likely to bottom out over the summer months — but that valuations may have more declines to undergo before similarly inflecting.
- The report’s analyst suggests that valuations would need to fall an additional 12% from Q1 levels to properly reflect the impact of higher interest rates. This will show up through rising cap rates, which they expect to climb another 80 bps before reaching a cyclical peak at the start of next year.
- Treasury yields are forecasted to stay elevated this year despite the prospect of rate cuts, while the report projects NOI yields to climb further in 2025 as the market rebuilds yield gaps to adjust to the new rate path before stabilizing in 2026.
- Office yields are expected to see the largest rises to close 2024, while industrial and apartments are expected to lead the way after, though the latter two sectors are projected to be first and second in rent growth between 2024-2028, respectively.
5. REIT MID-YEAR REPORT
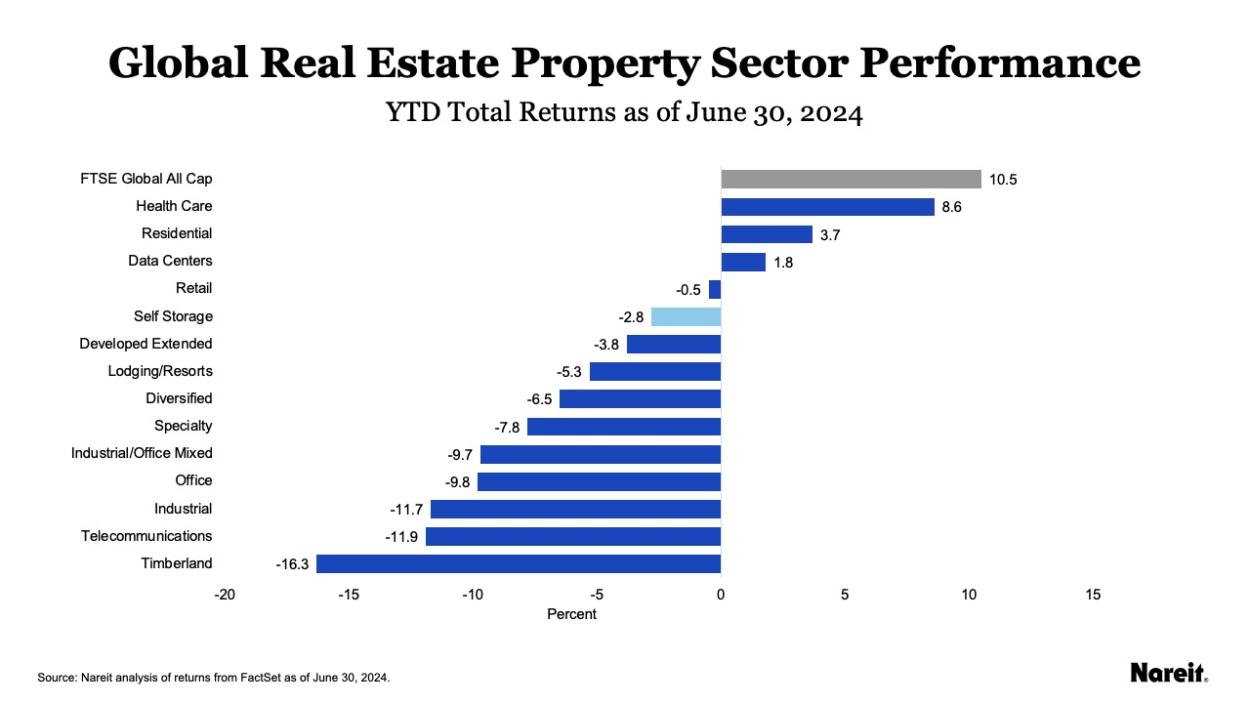
- Nareit reports that through June 30th, the FTS EPRA Nareit Developed Extended Index, an index series made up of REITs and global publicly listed real estate assets, was down 3.8% on a year-to-date basis.
- While in contraction, the latest data is an improvement from a 9.4% decline in mid-April that coincided with a spike in Treasury yields.
- Health care (+8.6% YTD), residential (+3.7% TYD), and data center (1.8% YTD) REITs have outperformed others in 2024. Timber (-16.3% YTD), telecommunications (-11.9% YTD), and industrial (-11.7% YTD) REITs, which represent close to a third of the index, have lead declines.
6. CONFERENCE BOARD US ECONOMIC FORECAST
- According to the Conference Board’s recent forecast for the US economy, released two weeks before the second-quarter GDP advanced estimate, GDP growth is expected to continue to slow in 2024 before picking up at year’s end and into 2025.
- The report forecasts a slowing economy in the short term as elevated prices and interest rates continue to sap demand. The forecast relied on first-quarter data that showed a dramatic deceleration in US GDP growth to just a 1.4% annual rate, down from 3.4% in the fourth quarter of 2023. Second-quarter 2024 GDP estimates were not yet available, but growth rates of 2% and 1% in the second and third quarters, respectively, were assumed in these projections.
- An acceleration of GDP growth at the turn of the year and into the next as inflation subsides and the Fed begins rate cuts. However, the trend of inflation in the next couple of months and the timing of the Fed’s first rate cut will dictate when this potential acceleration would begin.
7. CHIP AND SCIENCE ACTS SPUR CRE DEMAND
- A recent GlobeSt article investigates the impact of the CHIPS and Science Acts on commercial estate markets, as the 2022 laws introduced $52.7 in new spending, including both funding and incentives, for R&D and manufacturing in key science and tech sectors.
- The Texas market of Sherman-Denison was a key recipient of new federal funds with new semiconductor plants built by players like Texas Instruments and GlobiTech. The medium-term impact on the market includes the addition of up to 5,000 new jobs, bringing new residents and housing needs. The region is currently home to just 6,800 apartment units, reflecting the need for developers to fill the impending shortage.
- While the Real Page data underpinning the Sherman-Denison example focused on the multifamily impact, the article notes that retail demand has also likely increased, with school and healthcare needs likely to follow.
- Economists largely expect the laws to incentivize companies to increase manufacturing in the US and will benefit regions with strong labor force dynamics, available skills, and a diverse supplier base—thereby increasing demand in local real estate sectors. However, whether the economic stimulus of the medium-term investment in these sectors is sustained remains to be tested and will help determine the long-term viability of such CRE investments.
8. NAHB HOUSING MARKET INDEX
- According to the latest NAHB Housing Market Index (HMI), builder confidence in the market for single-family homes fell by one index point in July from the previous month.
- The downtick is a declaration from May and June, which saw the index decline three and two index points month-over-month, respectively.
- Present sales conditions fell during the month while expected sales conditions in the next six months rose, and traffic of prospective buyers declined.
- The July survey also showed that builders are increasingly cutting prices to bolster home sales, with 31% of all builders doing so in July compared to 29% in June and 25% in May.
- Despite the increased price cutting, the report notes that the average home price reduction held steady at 6% for the 13th straight month.
9. EXISTING HOME SALES
- According to the latest data from the National Association of Realtors, existing home sales declined by 5.4% between May and June to a seasonally adjusted annualized rate of 3.89 million units, the sharpest decline since 2022.
- June saw the fewest number of sales so far this year, and it was the fourth consecutive monthly decline in existing home sales, with median home sales prices climbing to a record high of $426,900.
- Unsold housing inventory rose by 3.1% from May to 1.32 million units, the equivalent of 4.1 months of supply at current housing prices.
10. RETAIL SALES
- US retail sales stalled in June, according to the latest data from the US Census Bureau.
- Following an upwardly revised 0.3% increase in May, retail sales were flat month-over-month. Sales at gas stations were down 3.0%, and sales for autos dropped 2.3%. Sales also fell at sporting goods, hobby, music, and bookstores.
- Meanwhile, sales at non-store retailers rose during the month, climbing 1.9% from May. Building materials and garden equipment sales were up 1.4%, while sales at health and personal stores rose 0.9%. Other items such as clothing, furniture, electronics and appliances, general merchandise, and food and drinking places also increased sales during the month.
- All in all, excluding gasoline, retail sales were up 0.2% in June, suggesting that consumer cutbacks in gas demand are not translating into a decline in broader consumption.
SUMMARY OF SOURCES
1. BANK STRESS TESTS
- According to the Federal Reserve, all 31 “systemically important financial institutions” (SIFIs) passed their annual stress tests. These tests evaluate the ability of large US banks to absorb hypothetical losses while maintaining more than their minimum required capital levels.
- The stress tests evaluated banks under a scenario where the unemployment rate surges to 10%, commercial real estate values fall by 40%, and housing prices fall by 36%. The results showed that large banks would take roughly $685 in aggregated hypothetical losses, but each would remain solvent.
- Following the recent failures of several mid-sized US banks, which, as a segment of the market, hold a disproportionate share of CRE on their balance sheets, the hypothetical resilience of banks shown during the stress tests is a welcomed sign. However, the stress tests evaluate only large and systemically important banks, leaving the conditions of regional banks in such potential scenarios relatively unknown.
2. COMMERCIAL PROPERTY PRICES
- According to the MSCI-RCA commercial property price index (CPPI), US commercial sector prices declined at an annual pace in May that was roughly similar to the rate seen in April.
- Prices fell 2.3% year-over-year through May and are down 0.2% from April.
- The industrial sector again arose as the only property type with an annual or monthly increase during the month, climbing 0.9% month-over-month from April and 8.7% over the past 12 months.
- Apartment sector prices fell by 0.1% month-over-month and by 8.9% year-over-year in May.The annual decline in retail prices eased for the 10th consecutive month but fell by 1.8% year-over-year through May. Retail prices are down 0.2% from April.
- Suburban Office properties reversed a monthly uptick in prices during April to post a 0.4% decline in May. Suburban office prices are down by 10.9% over the past twelve months. Meanwhile, CBD office prices continue to fall more steeply than their suburban counterparts, falling 1.4% from April and down by 30.8% year-over-year.
3. FLIGHT TO QUALITY IN OFFICE

- A recent Globe Street article points to a trend of flight to quality in the office sector, showing the nuances in office market activity despite recent struggles.
- Top their office marketbuildings maintain robust fundamentals. Rent premiums in prime office spaces sit at 84% while vacancy rates are down to 14.8%, 4.5% lower than the rest of the office market. Moreover, the sector’s performance gap has widened significantly from the 1.9% registered in 2018.
- Further, office market troubles have shrunk the sector’s construction pipeline, allowing more room for rent increases in prime space as they absorb remaining demand.
- The study notes that such prime spaces account for just 2% of US office buildings and that 60% of them were constructed in the past decade.
4. OFFICE MATURITIES TICK-UP
- According to recent data from Moody’s, a staggering $2.24 million across 23 CMBS office loans reached fully extended maturity in May.
- The 23 loans represent 54% of all maturities year-to-date. Moreover, loan size appears to play an essential role in determining payoff success. In both 2023 and 2024, smaller loans have paid off at a higher rate than larger ones.
- Year to date, Office loan maturities remain the lowest across all property types. 92.4% and 91.9% of Industrial and Multifamily loans have matured, respectively. When excluding malls, retail has seen a 78.0% payoff rate, but this falls to 53.9% when including mall loans. Meanwhile, 43.5% of Hotel loans are paid off through the end of May.
- Looking ahead, the balance of office loans maturing over the next 12 months totals $19.1 billion, 70% of which, according to Moody’s, have performance characteristics that indicate that they will face difficulties in refinancing.
5. BGO CRE OUTLOOK
- A recent Q2 2024 CRE outlook by BGO shows that market fundamentals remain firm, capital markets are stabilizing, and most emerging risks remain exogenous.
- As expected, Industrial maintains the strongest fundamentals across all of CRE, but some normalization and buildup of excess supply is expected in the coming months.
- On Retail, BGO maintains a positive outlook as low vacancies and healthy rent growth continues to keep the sector strong by historical standards.
- Multifamily has experienced a slowdown from its post-pandemic boom, with vacancies climbing in some of the markets that had the highest during the boom. BGO sees the vacancy rate stabilizing toward the end of the year before a potential down cycle in 2025, while rent growth is expected to gradually reaccelerate.
- Capital markets appear to be stabilizing, though transaction volume continues to be effectively flat. Delinquencies are increasing, and BGO sees this pattern continuing despite the likelihood of improved overall performance on the horizon.
- The report noted that monetary policy remains the primary risk to CRE and that, despite solid fundamentals, CRE markets will be beholden to the future path of interest rates.
6. ZOOMING IN ON HOUSING AFFORDABILITY
- Recent research from Zillow shows that a median-income household would need to put down 35.4% of their income to afford payments on a typical US home.
- The article highlights, for example, that a median-income household in Seattle making $116k would need to save 10% of their annual salary for 24 years to build up the savings that are typically expected for prospective homebuyers.
- Staggeringly, in 2023, 43% of home buyers used a gift from family or friends to help with their down payment.
- Affordability issues became increasingly salient as housing prices boomed during the pandemic years. Still, public policy responses have been slow to address them and are driven mainly by state and local initiatives. The US Department of Treasury recently outlined a new fund to provide an additional $100 million over the next three years to support the financing of affordable housing, while advocates are eyeing a White House budget proposal that would include mortgage relief credit for middle-class first-time homebuyers.
7. NAHB HOUSING MARKET INDEX
- According to the National Association of Home Builders’ Housing Market Index (HMI), each of the index’s components (current sales conditions, expected sales conditions, and traffic of potential homebuyers) fell in June from the previous month.
- The index, which evaluates homebuilder sentiment for the single-family home market, shows that builder confidence has stalled as interest rates have remained higher for longer than much of the market anticipated.
- Notably, this month’s survey shows that 29% of builders cut home prices in the past 30 days to boost sales, the highest share since January.
- May was the first month since December where each component of the HMI was in contraction.
8. RETAIL SALES
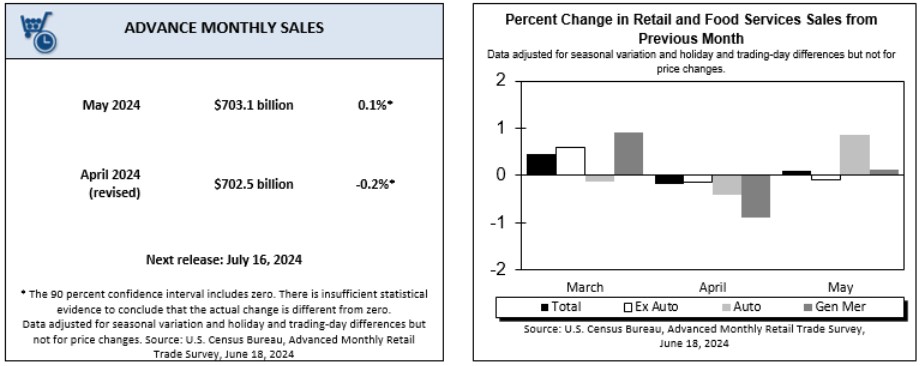
- According to the latest data from the Census Bureau, US Retail and food services sales (seasonally adjusted) rose by 0.1% in May from the previous month and 2.3% from one year ago.
- Overall, while positive, these data came in weaker than expected, with the Dow Jones consensus estimate forecasting a 0.2% increase during the month.
- Zeroing in on retail trade, sales were up 0.2% from April and 2.0% from May 2023. Over the past year, non-store retailers have seen an increase in sales of 6.8%, while food services and drinking places have increased by 3.8% over the same period.
- Following the report’s release, the likelihood of a Fed rate cut in 2024 climbed higher as measured by Fed funds futures markets.
9. CONSUMER CONFIDENCE
- Consumer confidence, as measured by The Conference Board, fell slightly in June but remained within its relative range over the past two years.
- Notably, the two subcomponents of the index, one measuring the present situation and one measuring future expectations, diverged in the latest reading. The Present Situation index rose during the month while short-term expectations fell. However, the expectations index metric has sat within the recession threshold for the last five months, which has failed to align with reality.
- Peeling one layer deeper, consumers expressed an overall increase in confidence in labor market conditions within both the present situation and expectations index. In contrast, their views on income and business conditions fell in both components.
- The report also noted that the decline in confidence was primarily driven by consumers aged 35-54, while the cohorts above and below this age group saw a boost in confidence.
10. RISING COSTS IN THE MULTIFAMILY SECTOR
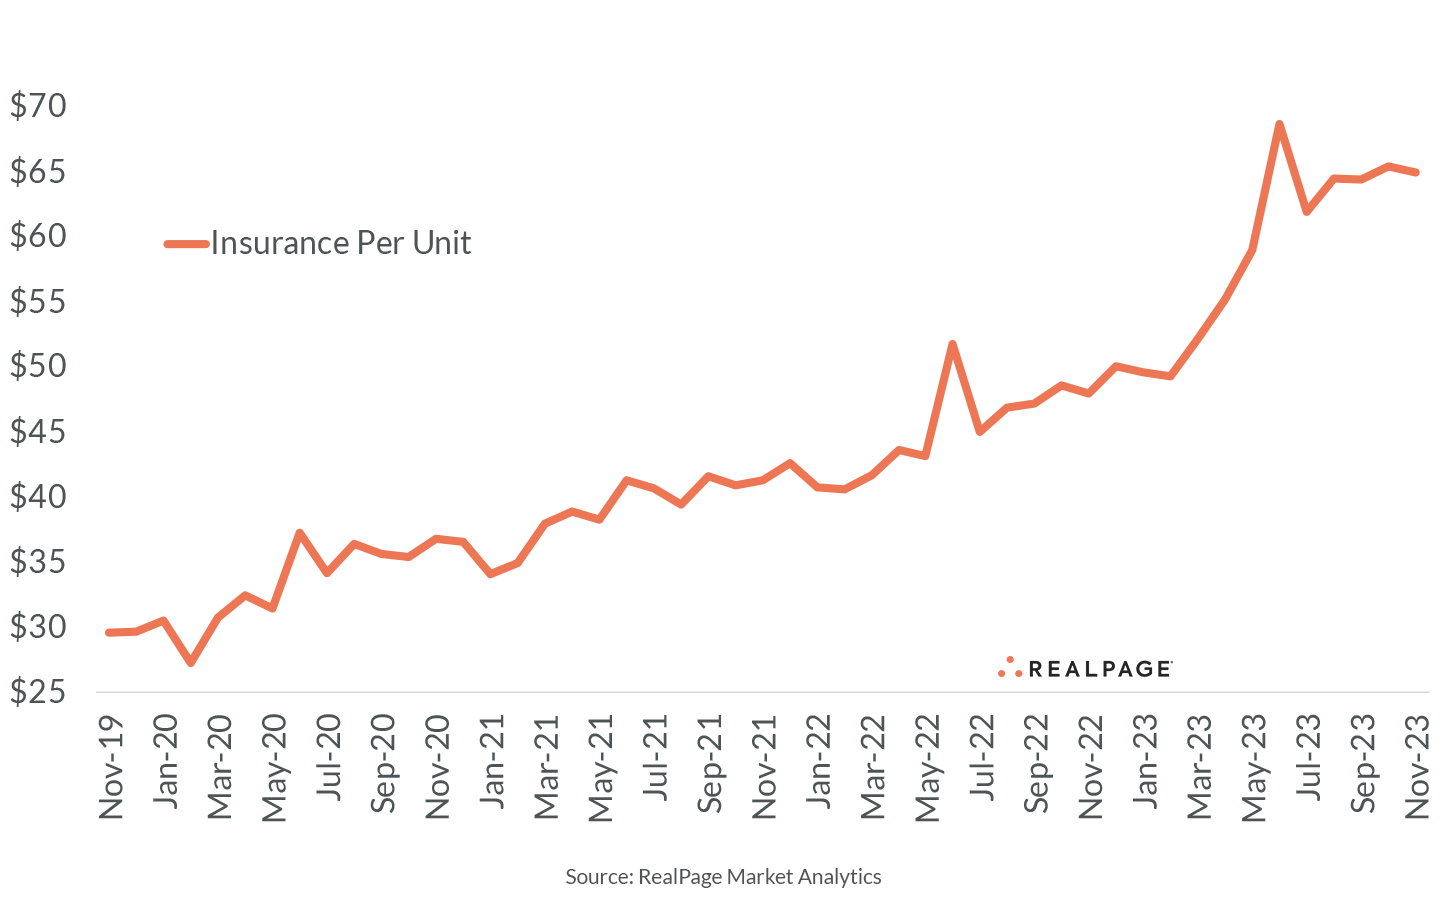
- A recent study by the Joint Center for Housing Studies at Harvard University shows that rising insurance premiums were the main cause of higher operating costs in the Multifamily sector heading into this year.
- Citing data from RealPage, the report detailed that through January 2024, insurance premiums in the sector rose 27.7% year over year and were a significant contributor to the 7.1% increase in total operating expenses over the same period.
- Within the nation’s top 50 metros, per-unit insurance costs have more than doubled since the start of the pandemic. Further, NOI growth slowed to just 2.8% in Q1 2024 compared to 24.8% at the end of 2021.
- The rising costs can increase the risk of multifamily loan delinquencies. However, the report notes that delinquencies in the CMBS market remain well below their GFC comparisons and just slightly above their pre-pandemic average.
SUMMARY OF SOURCES
1. CRE LOAN MODIFICATIONS RISE AMID HIGH-RATE ENVIRONMENT
- According to a new report by Trepp, CMBS loan modifications rose dramatically in 2023 as a significant swell of loans are set to mature in the coming quarters.
- Modification volumes peaked mid-year 2023, climbing to $3.9 billion during the third quarter, almost nine times higher than levels one year before.
- Perhaps unsurprisingly, Office loans have received the largest volume of new modifications recently, making up roughly 42% ($4.2 billion) of all modifications made during 2023. Retail was the second largest, with $2.6 billion in loans modified.
- The jump in loan modifications within the CMBS universe signals how the broader Commercial Real Estate financing system is beginning to tackle the looming challenge of new financing needs amid lower property values and higher interest rates.
- Instead of refinancing old loans, borrowers are increasingly seeking extensions or amendments to current loan terms. These can sometimes involve the borrower committing new capital in the form of paying down debt, investing in renovations, or making other tenant improvements.
2. AI FUELS DATA CENTER BOOM

- A recent report by Baystreet estimates that Data Center investments have surged by more than 200% since 2016. The traditionally more niche asset class is expected to expand by another 89% between now and the end of 2028 as AI propels the property type to new heights.
- Several tech companies and firms that have been early to invest in generative AI have sat at the forefront of the recent trend. Big names such as Amazon, Applied Digital Corporation, and Avant Technologies, among others, signal that they expect to expand their AI infrastructure further as demand continues to boom.
- The intersection of AI and Commercial Real estate reveals recent activity by industry lenders and could signal broader trends in real estate finance. For example, Equinix, Inc., another large player in the digital infrastructure space, has recently launched a $600 million joint venture with PGIM Real Estate to help develop and operate a new Data Center in Silicon Valley.
- As more traditional CRE lenders, such as mid-sized regional banks, pull back from real estate investments due to the interest rate climate, alternative lenders like PGIM are stepping into the vacuum. As an emerging and less matured asset class, data center investment activity by traditional alternative lenders will be an interesting indicator to watch.
3. HOME PRICES IN TOP METROS HIT RECORD
- According to the latest data from S&P/CoreLogic, home prices in the top 20 major US metros climbed to their highest level on record in March.
- The S&P CoreLogic Case-Shiller 20-city house price index rose 0.3% monthly and 7.4% year-over-year in March, the latest month of available data.
- After eight consecutive months of price deceleration that partly overlayed three months of price declines, national home prices tracked by the Case-Shiller Index reaccelerated in the three months ending in March.
- Housing prices in major markets continue to face upward pressure from falling inventories, which is further exacerbated by the start of the Spring homebuying season.
- In recent weeks, pressure on inventories has eased slightly. According to the National Association of Realtors, housing inventory totaled 1.21 million units at the end of April, 9% above March’s level and up 16.3% from the same time last year. Still, as pricing trends show, this pace has not kept up with demand.
4. COMMERCIAL REAL ESTATE PRICES
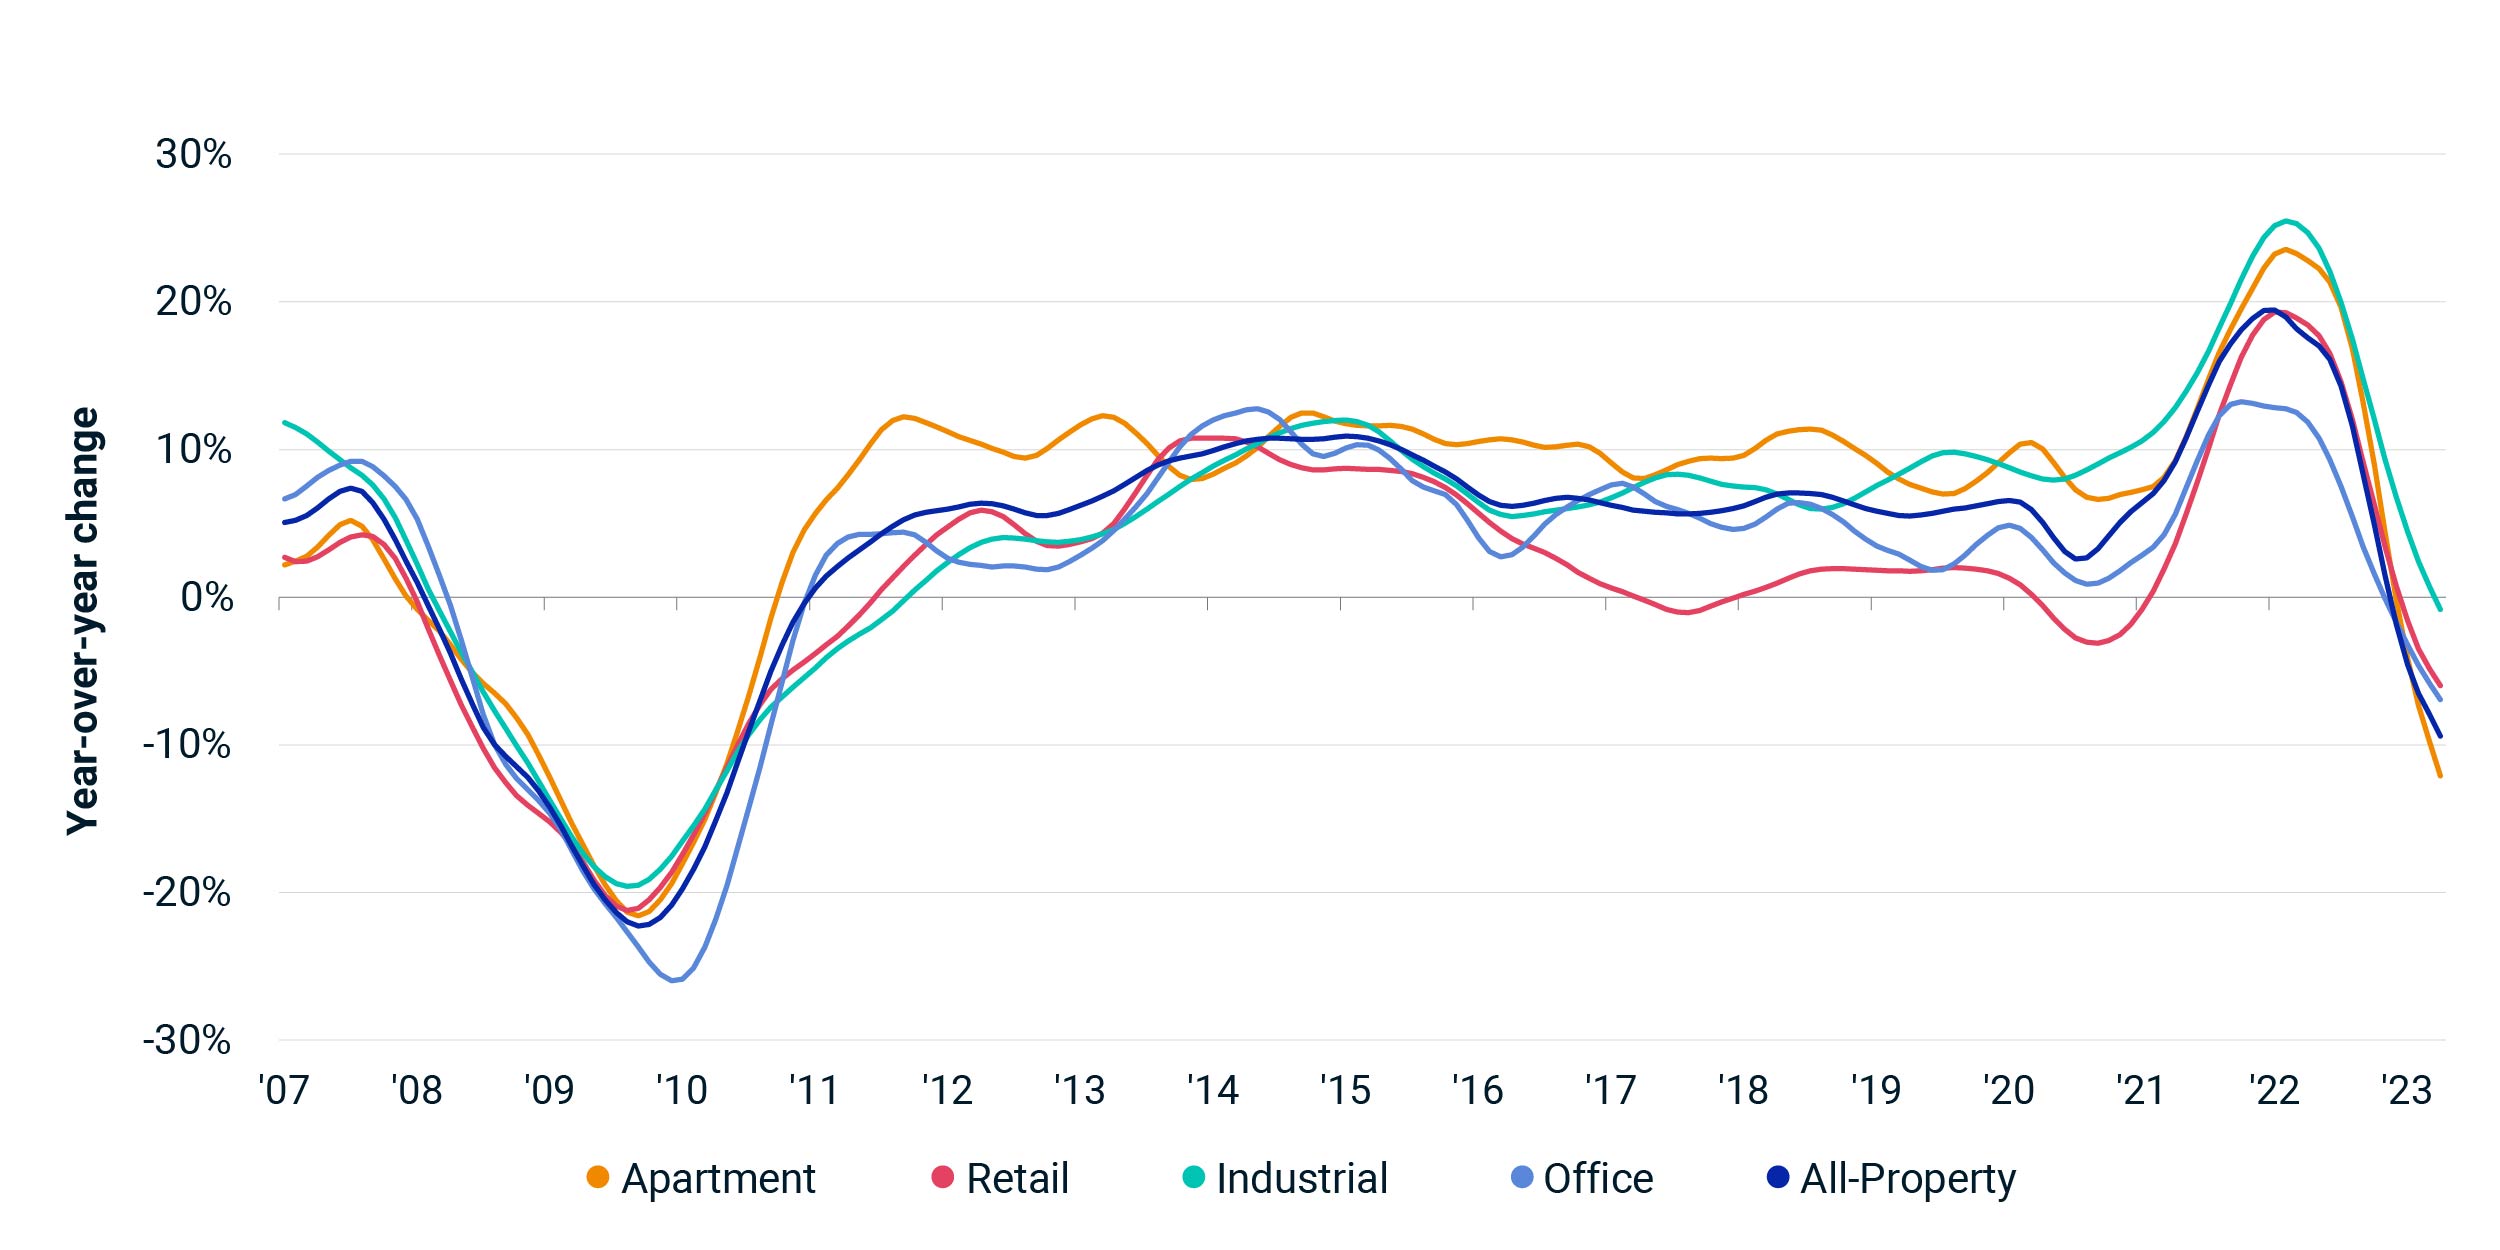
- According to the MSCI-RCA commercial property price index (CPPI), the pace of decline in US commercial sector prices slowed for the ninth straight month in April.
- Prices fell 2.2% year-over-year through April and just 0.1% from March.
- The industrial sector again arose as the only property type with an annual increase during the month, climbing 0.6% month-over-month from March, its 12th consecutive monthly increase. Industrial prices are up 6.0% over the past 12 months.
- The annual pace of decline for Apartment sector prices has slowed in each of the last eight months, with prices charting a 6.9% year-over-year decrease in April. Monthly, Apartment sector prices are down 0.3%,
- Retail sector prices also improved. The sector’s annual price decline eased for the ninth consecutive month to 2.6% year-over-year in April. However, relative to March, sector prices are down.
- Suburban Office properties experienced a slight monthly uptick, rising 0.5% month over month. Annually, CBD office prices continue to fall more steeply than their suburban counterparts, falling 33.9% year over year compared to just 7.8%.
5. LUXURY RETAIL EXPANDS
- According to new reporting by Globe St that analyzes trends in New York and major European markets, leading luxury retailers are snapping up store space.
- High-end retailers are increasingly opting to purchase prime units in major cities across the globe instead of leasing as they take advantage of discounted property prices.
- According to Bernstein Research, European luxury brands have paid upwards of $9 billion since the beginning of 2023 to buy prime space in the world’s top shopping locations, such as New York and Paris.
- Some brands have indicated that they continue to bet on consumers’ spending resilience, which is expected to experience its fourth consecutive annual increase in 2024.
6. OFFICE EXPOSURE RISK
- Commercial Edge’s May 2024 national office report details the risk several markets could be exposed to concerning Office sector distress.
- Analyzing debt service coverage ratios (DSCRs), which measure net operating income against current debt obligations, the report notes that only five of the 91 markets in focus had DSCRs below 1.0, a level that the researchers associate with high risk.
- Lenders often require a DSCR of 1.25 to consider a business to have sufficient net operating income to repay a loan. The report found that only a handful of markets are presently exposed to widespread risks.
7. CONSUMER CONFIDENCE REBOUNDS
- According to the latest release, the Conference Board’s Consumer Confidence Index rose in May following three consecutive monthly decreases.
- US consumers showed an unexpected surge in optimism over the past month as the labor market outlook improved. Still, inflation concerns persist, and as a result, households continue, on average, to expect higher interest rates over the next year.
- The survey’s underlying data suggested a more mixed outlook. The share of consumers who expect a recession over the next 12 months increased on a month-over-month basis. Conversely, consumers remain relatively upbeat about the stock market.
- In a potential foreshadowing of how May’s mixed report could translate into consumer spending trends, the share of respondents indicating that they plan to buy a major household appliance also ticked up from April.
8. FEDERAL DEBT WORRIES
- As the US national debt approaches $35 trillion, there are increasing concerns about the nation’s fiscal health.
- Since the onset of the COVID-19 pandemic in March 2020, the federal government has added about $11 trillion in debt. While US economic growth and the dollar’s position as a global reserve currency have often placed deficit reduction on the back burner of fiscal priorities for both political parties, recent debt growth is again raising some alarms.
- The four-year uptick is largely due to a massive expansion of government spending, namely the pandemic-era stimulus packages in 2020 and 2021, followed by the 2022 Bipartisan Infrastructure and Inflation Reduction Acts.
- Increasing deficits have also been exacerbated by previous reductions in tax revenues, including the 2017 Tax Cuts and Jobs Act, and the increasing strain from rising interest rates, which increase the government’s debt liability.
- The Congressional Budget Office (CBO) estimates that the public’s debt-to-GDP ratio, which currently stands at 99%, will rise to 116% over the next decade, which would become its largest proportion in history.
- The CBO projects a $1.6 trillion deficit for 2024 that will increase to $2.6 trillion by 2034 if current fiscal revenues and spending levels continue on trend. Many economists note that the US has historically only experienced such deficit-to-GDP levels during wartime or severe downturns. Such levels could place the US government in a position of fiscal vulnerability during a downturn.
9. FOMC MEETING MINUTES

- According to the meeting minutes from the FOMC’s April 30th- May 1st policy meeting, while policymakers continue to expect inflation to remain on its trend towards 2% over the medium term, most believe that recent data has necessitated a more cautious approach.
- The minutes point to an increasing sentiment among officials that the disinflation processes will likely take longer than previously thought. Some members also indicated a willingness to raise rates further if inflation pressures mount.
- As inflation data trended in an unfavorable direction over the first quarter of 2024, officials have grown notably more cautious in their statements on the future path of rate policy but have mostly refrained from overly hawkish sentiments that would indicate a return to rate hikes.
- So far, FOMC officials have responded to this year’s inflation risks by leaving their benchmark Federal Funds Rate unchanged at recent meetings. However, they have left the door open to rate cuts later in the year if underlying economic data improves.
10. INTEREST RATE OUTLOOK
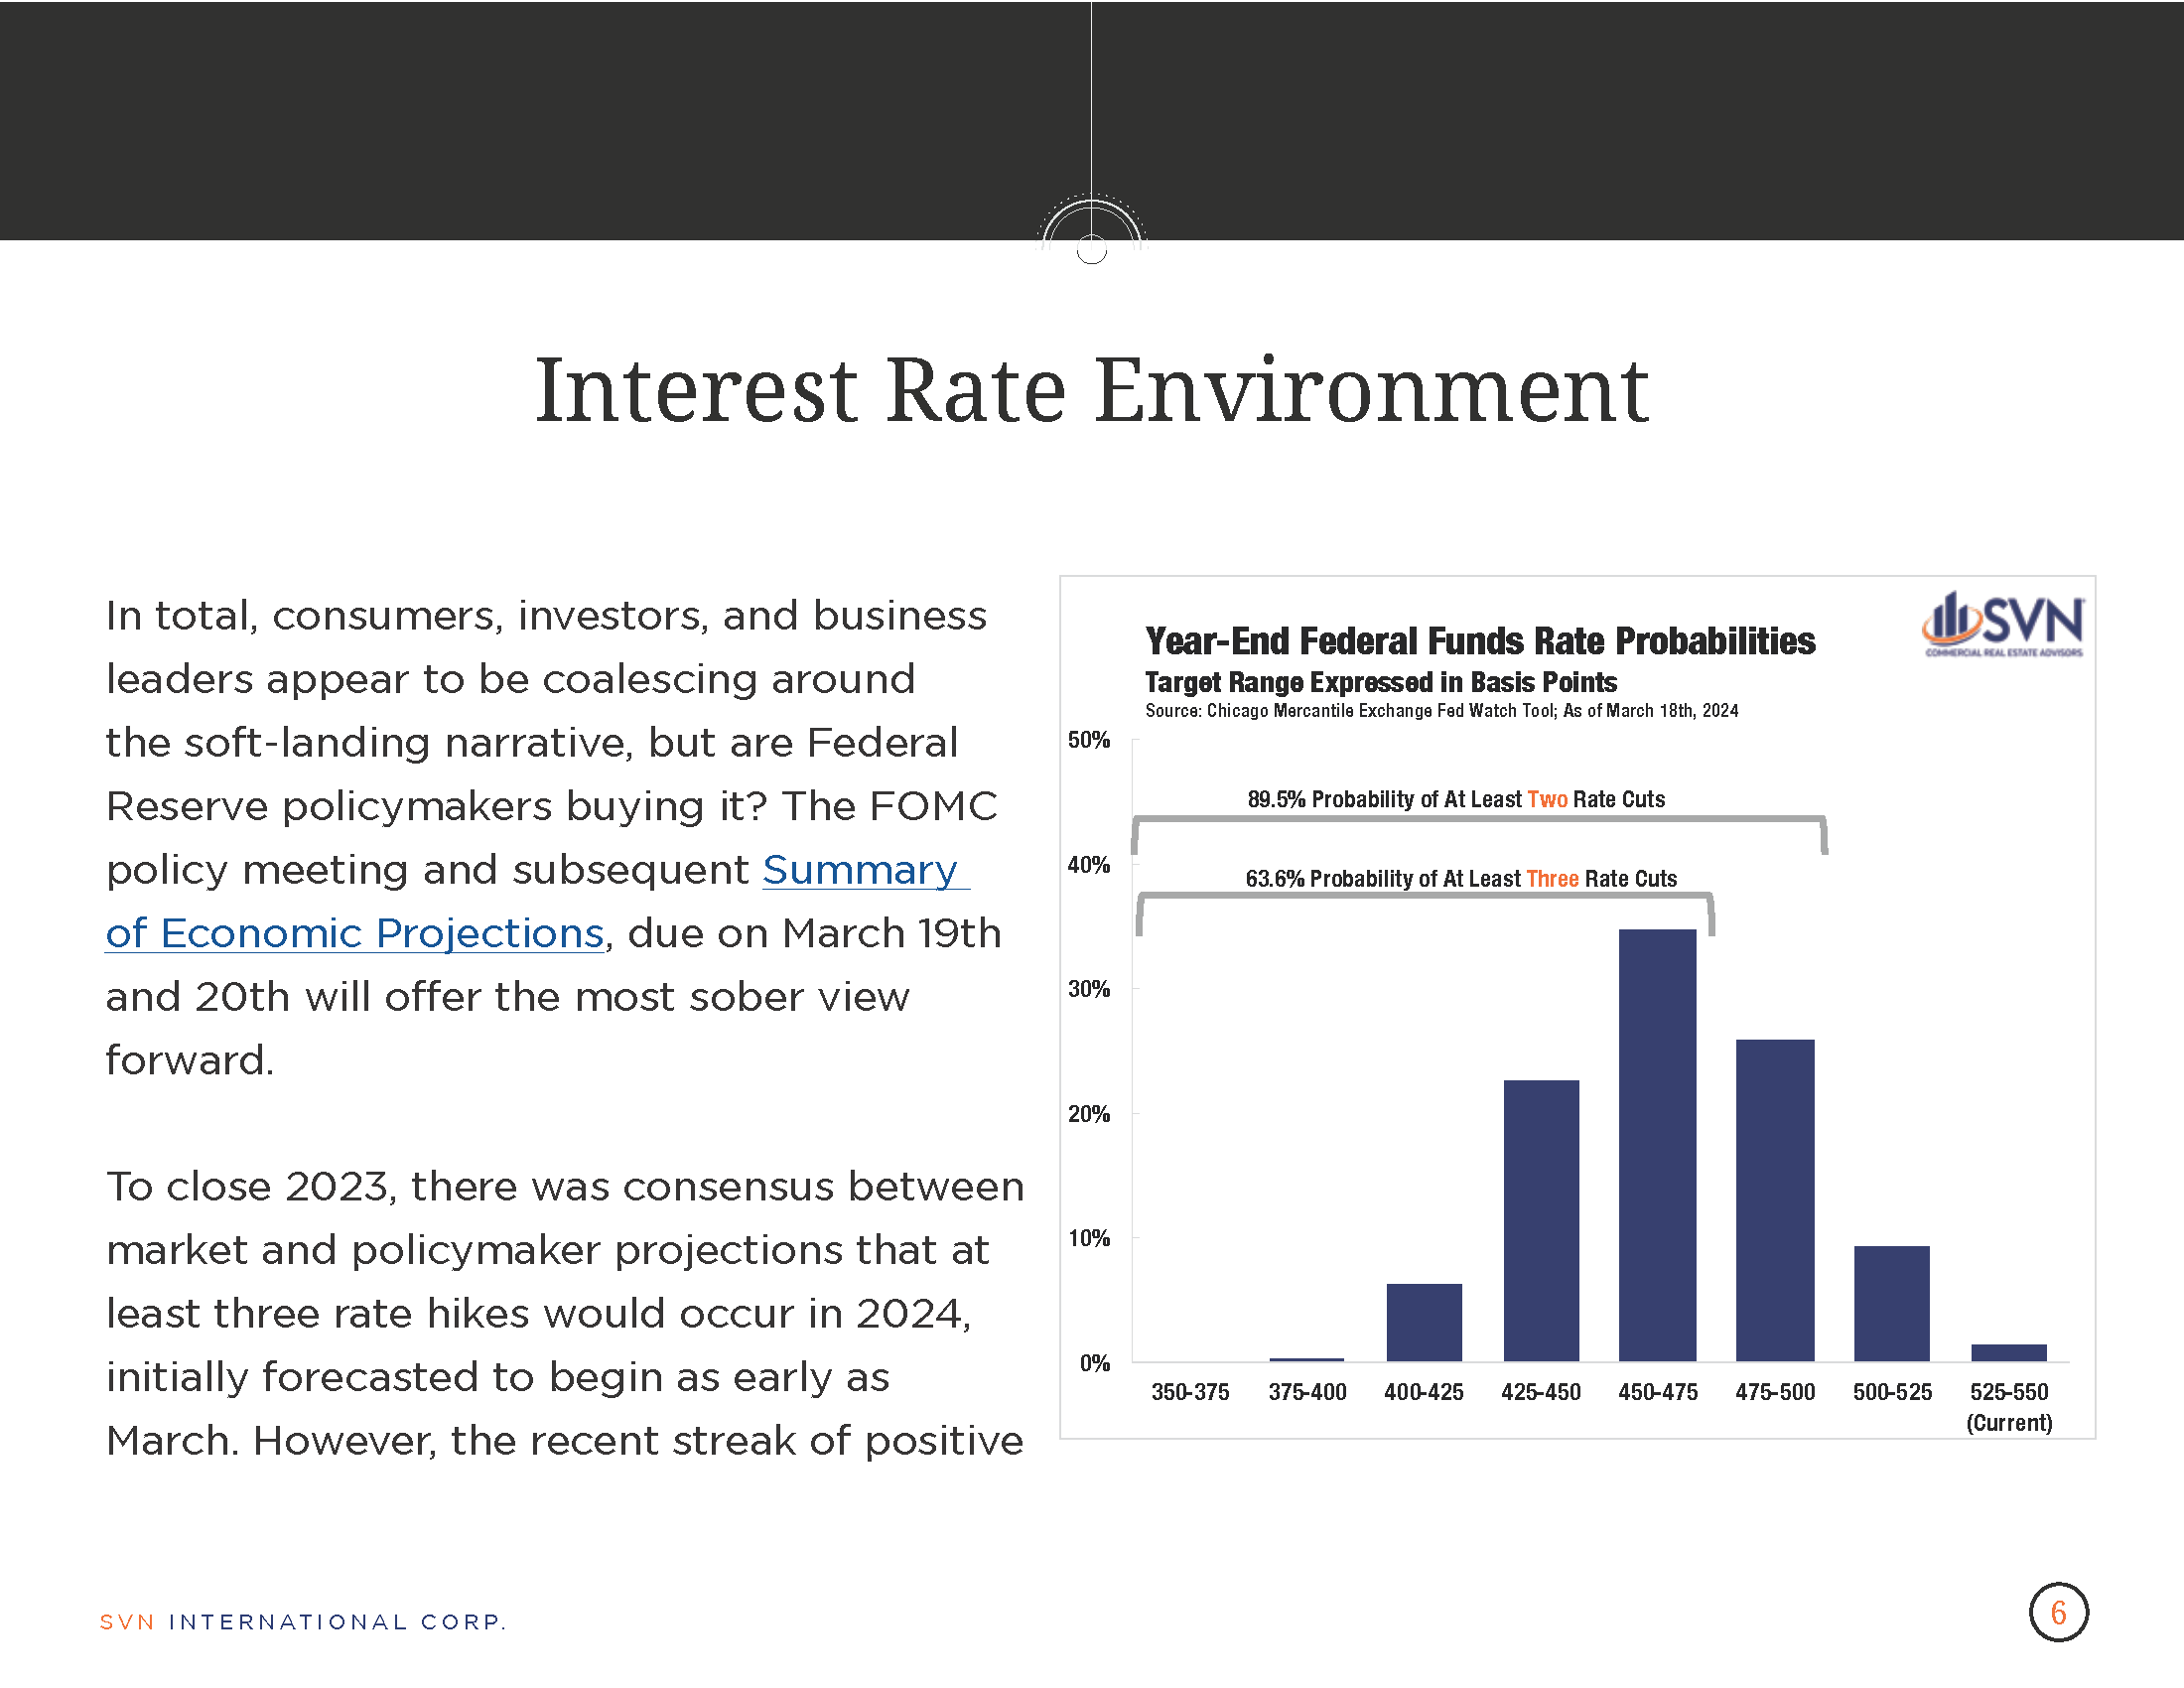
- According to the Chicago Mercantile Exchange’s Fed Watch Tool, the average futures market forecasts for the Federal Funds Rate at the end of 2024 have recently shifted to reflect only one quarter-percentage point cut.
- Futures markets place a 42.1% chance that the Fed funds rate will finish the year 25 bps down from its current level. The shift is a significant recalibration from earlier this year when futures markets projected at least three quarter-point cuts in 2024.
- Higher than expected inflation pressures to start 2024 have resurfaced futures markets’ hawkish sentiments, aided by recent Fed commentary suggesting a longer path ahead toward a pivot.
SUMMARY OF SOURCES
1. FIRST-QUARTER GDP
- The US economy expanded by a 1.6% annualized rate during the first quarter of 2023, according to the latest data from the US Bureau of Economic Analysis.
- First quarter GDP fell short of most estimates. Economists surveyed by Bloomberg, on average, forecasted a 2.5% pace of growth during the quarter.
- Q1 2024 was the second consecutive quarter where economic output slowed. It was also the lowest pace of growth since the economy contracted in the first half of 2024.
- Consumer spending slowed to an annual pace of 2.5% compared to 3.3% during Q4 2023. The downtick was mainly due to a fall in goods consumption while spending on services accelerated.
- Interestingly, the slowdown in consumption defies an uptick in price pressures evident in the March CPI release and challenges the reliability of recent inflation metrics. A central theory to this inconsistency is that inflation metrics’ use of “owners’ equivalent rent” as a proxy for rental costs distorts their shelter components, potentially resulting in overestimating price increases.
- Non-residential investment eased during the first quarter, but residential investment jumped tremendously, climbing from 2.8% during Q4 2023 to 13.9% in the latest reading.
- Government spending decelerated from an annualized 4.6% to 1.2%. Exports slowed sharply while imports soared. Meanwhile, private inventories continued to contract.
2. COMMERCIAL REAL ESTATE PRICES
- According to the MSCI-RCA commercial property price index (CPPI), the pace of decline in US commercial sector prices slowed for the eighth month in March.
- Prices fell 3.0% year-over-year through March and just 0.2% from February.
- The industrial sector again arose as the only property type with an annual increase in March. The average price on an Industrial property climbed 0.7% month-over-month from February and 5.7% over the past 12 months. Annualizing the Industrial sector’s growth in March would bring the sector to a 9.2% increase over the next year.
- The pace of decline for Apartment sector prices has slowed in each of the last seven months, with prices charting an 8.4% year-over-year decrease in March. On a monthly basis, the Apartment price index has declined for 20 consecutive months. Still, the sector is up 11.0% above its pre-pandemic level.
- Retail sector prices also improved. The sector’s annual price decline narrowed for the eighth straight month to 1.2% in March. Retail also joined Industrial as the only sector that saw prices climb monthly, climbing 0.1% from February.
- CBD office prices continue to fall more steeply than their suburban counterparts, falling 33.2% year-over-year compared to just 11.4%.
3. DOWNTOWN RECOVERY TRENDS
- Cell phone activity data tracked by the University of Toronto School of Cities show that between March 2023 and March 2024, downtown US and Canadian cities saw a median increase of 9.3% in foot traffic.
- While the findings do not detail the type of places where new activity occurs, they suggest that most downtown areas continue to gradually recover from the pandemic.
- Of the metros tracked, 50 cities have downtown areas experiencing a recovery compared to 14 that are trending downward.
- Notably, the report points out that among the metros trending downward are cities that had previously topped their rankings, suggesting that many of them recovered more quickly.
- The top five metro areas by year-over-year downtown activity growth were Minneapolis (+45.7%), Ottawa (+39.5%), Montreal (+38.6%), Chicago (+36.6%), and Louisville (+31.9%).
4. FED’S BEIGE BOOK SUMMARY
- According to the Federal Reserve’s latest Beige Book, nationwide economic activity has expanded slightly over the past six weeks. Still, performance has varied by region. 10 of 12 districts reported slight or modest increases in economic growth, up from 8 in the last round of reporting. Still, mixed sales activity across the 12 Fed districts meant that overall, consumer spending saw only a slight increase in consumer spending.
- Several districts reported declining discretionary spending as consumers remain increasingly price-sensitive to several goods categories. Some districts saw auto sales rise as inventories improved and dealerships wooed buyers with new discounts and incentives. Others saw modest increases in tourism as the spring season began, but reports vary.
- Commercial real estate leasing fell slightly, while non-residential construction was essentially flat. The most positive CRE sentiment came from the Minneapolis Fed district, where construction activity improved slightly.
5. CRE OUTLOOK IMPROVING, SAYS DOUBLE LINE
- A new research paper by DoubleLine suggests that a 2024 pivot in the Federal Reserve’s interest rate policy will open the door for price discovery and improve the market’s stability generally.
- As the interest-rate outlook becomes clearer, commercial real estate transaction activity should pick up, and market pricing will become more transparent. The report suggests that these mechanisms will allow for improved credit access and unlock existing demand.
- Roughly $2.8 trillion of CRE debt will mature between 2024 and 2028, making price discovery crucial as lenders seek market share.
- The paper expects payoff outcomes to persist among multifamily, industrial, and lodging while larger office loans and struggling mall properties may face additional refinancing difficulty.
6. NMHC APARTMENT INDEX
- According to the latest quarterly release of the NMHC Apartment Index, while rent growth in the Multifamily sector has slowed in recent quarters, sales volume has increased, and the equity financing environment has become more favorable.
- The first quarter of 2024 was the first time in two years that the Multifamily sector saw higher deal flow than the previous quarter. 21% of respondents surveyed by NMHC reported higher sales than just 6% during the final quarter of 2023.
- Equity financing improved marginally, but 60% of respondents found that availability was unchanged. Meanwhile, the debt financing environment has become tighter, with the Fed’s decision to push back potential rate cuts noted as a primary culprit.
7. FIVE APARTMENT MARKETS WHERE RENTS HAVE ROOM TO GROW
- According to a recent Chandan Economics analysis of Zillow data, as a home price rally during the pandemic spurred massive rent growth across the nation, some markets have seen home prices grow more quickly than rents. The gap suggests several of these rental markets have room for growth in the years ahead.
- McAllen, TX; Charlotte, NC; Durham, NC; Raleigh, NC; and Seattle, WA were identified as the top five metros for rent growth opportunities. Each metro has experienced a 20% or more difference between the growth rates of its home values and observed rents over the past four years.
- Since 1985, rents and home prices across the 100 largest US metros have had a 96% correlation. Cyclical factors such as those experienced during the pandemic can distort such longer-term structural relationships, suggesting that several of these markets may close the gap over time.
8. RATE UNCERTAINTY TAMES HOMEBUILDING MOMENTUM
- According to the latest data from the NAHB/Wells Fargo Housing Market Index (HMI), homebuilding held steady during April. Still, it ended four consecutive months of increases as interest-rate uncertainty dampens new activity.
- The components measuring current sales conditions and the traffic of prospective buyers each increased, albeit slightly. Meanwhile, sales expectations for the next six months fell somewhat.
- The report suggests that April’s flat reading indicates that homebuilding demand is present but in a holding pattern as would-be buyers asses the interest-rate outlook. As the potential for rate cuts in 2024 becomes clearer, pent-up demand may continue to materialize.
9. CRE FORECLOSURES JUMP
- According to data from ATTOM, foreclosure filings rose by 117% year-over-year through March 2024, with roughly 625 CRE foreclosures in just the past month.
- Foreclosures are up 6% from February. The figure considers commercial properties with at least one filing of a default notice, scheduled auctions, or bank repos.
- Foreclosures have risen steadily since May 2020, when, for context, they hit a record low of 141 properties during that month.
- California had the highest concentration of foreclosures during March, with 187, accounting for almost 30% of all foreclosures during the month. The Golden State has had an astonishing 405% year-over-year jump in CRE foreclosures.
10. PCE PRICE INDEX
- According to the latest data from the US Bureau of Economic Analysis, the PCE price index experienced its largest annual increase in four months. However, core prices (mirroring February’s rate) repeated their slowest rise in three years.
- The headline PCE price index rose 2.7% year-over-year, up from 2.5% in February.
- However, the core-PCE price index, the Federal Reserve’s preferred inflation metric when considering monetary policy, rose by a steeper 2.8% year-over-year in March. Alongside a similar uptick in February, it is the slowest increase for core prices since March 2021.
- The latest PCE data caps a complex month of data releases. Recent job growth and consumer prices rose higher than expected while consumer spending and the prices of those expenditures slowed.
SUMMARY OF SOURCES
- (1) https://www.bea.gov/news/2024/gross-domestic-product-first-quarter-2024-advance-estimate
- (2) https://info.msci.com/l/36252/2024-02-21/y1htr4/36252/1708559067qvvmBG37/2402_RCACPPI_US.pdf
- (3) https://downtownrecovery.com/charts/trends?utm_source=newsletter&utm_medium=email&utm_campaign=newsletter_axioswhatsnext&stream=science
- (4) https://www.federalreserve.gov/monetarypolicy/beigebook202404-summary.htm
- (5) https://doubleline.com/wp-content/uploads/DoubleLine-Commercial-Real-Estate-Update_2-6-24.pdf\
- (6) https://www.nmhc.org/research-insight/quarterly-survey/2024/nmhc-quarterly-survey-of-apartment-conditions-april-2024/
- (7) https://www.chandan.com/post/five-apartment-markets-where-rents-have-room-to-grow
- (8) https://www.nahb.org/news-and-economics/housing-economics/indices/housing-market-index
- (9) https://www.attomdata.com/data/foreclosure-data/
- (10) https://www.bea.gov/data/personal-consumption-expenditures-price-index#:~:text=A%20measure%20of%20the%20prices,reflecting%20changes%20in%20consumer%20behavior.


1. INDUSTRIAL’S LARGEST OPERATORS EXPAND
- According to an article by Commercial Observer, Industrial real estate heavyweights Prologis and Link Logistics are leading an ongoing expansion in warehouse use despite recent reports of a post-COVID-boom slow in demand.
- Industrial real estate demand has softened in recent months but has retracted from record double-digit growth experienced in 2022 and early 2023. E-commerce’s share of retail sales remains in a new post-pandemic paradigm, and while near-term growth may slow, operators with ample liquidity and a long-term eye remain active in the current environment.
- The CEOs of both companies indicated that they expect to add similar or higher leasing volume in 2024 compared to last year. Link Logistics added 86 million square feet of leased space in 2023, including 23 million in the fourth quarter. Prologis is looking to add up to $3.5 billion in new development in 2023 and expects occupancy levels to remain at or above 96%.
2. HOMEBUILDER SENTIMENT RISES
- Based on data from the NAHB/Wells Fargo Housing Market Index, homebuilder sentiment about housing market sales conditions rose to its highest level in eight months.
- The index measuring views of current sales conditions rose four points to 56. Conditions have steadily rebounded since reaching a recent nadir of 24 in November 2023. Index measures above 50 indicate positive sentiment.
- Expected sales conditions over the next six months also increased, climbing two points to 62. Prospective buyers’ traffic rose similarly two points to 34.
- NAHB economist Robert Dietz mentions that as potential rate cuts stimulate demand, rising material prices, particularly lumber, will impact homebuilder activity. Rising activity could also impact logistics and warehouse inventories as market intermediaries ramp up to meet demand.
3. MIXED-USE PROPERTIES
- As trouble in the Office sector causes some investors to consider repositioning their portfolios, mixed- used projects are emerging as a prospective choice for developers.
- Mixed-use projects bring together office, retail, and residential spaces and offer a medium for reimaging at-risk sub-sectors like indoor shopping malls and CBD office spaces.
- Jamestown, a real estate developer, has utilized the mixed-use approach to implement ambitious projects that accommodate varied local market environments, such as in Atlanta, Brooklyn, and Raleigh.
- Mixed-use projects also offer developers a way to test the success of newer and emerging product types such as advanced manufacturing, life sciences, flex-living, and health and wellness alongside more tried and tested concepts such as traditional residential and retail space.
4. COASTAL PROPERTY VALUES DEFY CLIMATE RISKS
- Despite risks from sea-level rise and storms, US coastal communities remain a hotspot for growth as high-income residents continue to purchase in and populate these areas.
- Coastal property values continue to climb, with both market and policy forces appearing to be at play. A recent study by Nature found that a combination of stable property values for investment, tax advantages for high-income owners, and subsidies for coastal management activities such as beach nourishment have dampened the effect of sea-level rise on coastal property values.
- Still, the report cautions that such effects are likely temporary and that policy components, such as subsidies and tax advantages, distort the price signals that typically reflect longer-term risks.
5. COMMERCIAL PROPERTY PRICES
- According to the MSCI-RCA commercial property price index (CPPI), the decline in US commercial sector prices slowed further in February, declining just 4.0% year-over-year.
- Price declines in CRE have been consistent over the past year and a half, but in February, they fell at their slowest pace of annual decline since 2022 and dropped just 0.3% month over month.
- The industrial sector again emerged as the only property type with an annual increase, growing by 1.9% year over year and 0.2% month over month.
- Apartment sector prices declined 8.9 % year-over-year but extended a six-month-long moderation in annual price declines for multifamily properties. Still, apartment prices posted the largest month-over-month decline across all sectors, falling 0.1%.
- Retail sector prices were flat month-over-month, but annual returns fell by 2.5%. Notably, annual price declines in the sector have softened from the double-digit declines seen during the third quarter of 2023.
- Suburban office prices fell 11.6% year over year and 0.4% month over month. Meanwhile, CBD office valuations fell 29.9% annually and 1.3% monthly. The differing magnitudes of devaluation largely reflect each subtype’s sensitivity to remote work. The negative demand shock appears most intense in dense, high-price office markets.
6. FED INTEREST RATE DECISION
- The Federal Reserve held interest rates steady at its March policy meeting, in line with market expectations that policymakers would continue its wait-and-see approach for the time being.
- Both the Fed and fed futures markets, as indicated by the Chicago Mercantile Exchange’s Fed Watch Tool, kept consistent their projections of three rate cuts by the end of 2024.
- Inflation has come down consistently over the past year, but resilient labor market and consumer spending dynamics have kept price pressures salient and inflation expectations elevated.
- In his post-meeting statement, Fed Chair Jerome Powell stated that the committee is prepared to maintain current interest levels for longer if needed to re-anchor price stability and expectations.
7. CORPORATE TO CRE DEBT SPREAD HITS 24-YEAR HIGH
- Based on data from MSCI, a snapshot of US capital markets shows that the spread between corporate versus commercial real estate debt rates has risen to a high of at least 24 years.
- Dating back to 2000, mortgage rates were consistently low relative to the cost of corporate debt except for during the worst parts of the Great Financial Crisis (GFC), according to the MSCI analysis.
- The rising relative cost of CRE debt indicates that investors are recalibrating the sector’s risk profile relative to other investments. Higher interest rates impact investor returns, with investment funds feeling the pinch recently, according to the report.
8. CRE TOP RISK, SAYS UBS
- UBS recently flagged a potential commercial real estate downturn as a “top and emerging risk” that it’s preparing for in 2024. It cited higher borrowing costs and slumping demand as potential headwinds in its outlook.
- In its annual 2023 report, UBS noted that “adverse effects on valuations from higher interest rates” and a “structural decline in demand for office and retail” could trigger impacts on the bank, given its exposure to the sector.
- UBS’s citing of CRE risks does not suggest a significant CRE downturn. Still, it indicates how shifting supply and demand dynamics may affect the balance sheets of financial firms invested in at-risk assets. The broader CRE market remains a story of diverging sector-level performance and varied metro-area trends.
9. CONTEXTUALIZING CRE RISKS TO BANKS
- According to a recent report by Cohen and Steers, CRE risks to the banking system are spread across large, mid, and small-sized institutions, significantly mitigating potential risks to the financial system.
- The top 25 largest US banks by total assets hold 13% of all commercial real estate mortgages but have just 4% of their total assets exposed to the sector.
- Regional and community (mid-sized) banks are more exposed relative to the market as they hold roughly 30% of all CRE mortgages and, on average, have a 20% balance sheet exposure.
- Banks outside of the top 100 account for roughly 15-20% of all CRE mortgages, but exposure is spread across more than 4,500 institutions nationally.
- Further, their debt service coverage ratios indicate that loan term default risks and low and underwritten values on existing loans are low, as property values have risen over the past ten years.
10. NAR SETTLEMENT
- A recent landmark settlement between the National Association of Realtors and consumer advocates reforms how brokers can charge commissions on home sales, eliminating the standard 5-6% fees charged to sellers to have their homes posted on Multiple Listing Services (MLS).
- If approved, the settlement would open MLS sites to negotiated pricing, and changes to the brokerage fee structure would take effect within months of approval. A hearing on whether to approve the deal is set to take place in the next few weeks.
- Advocates of changes to the system point out that the settlement could increase price transparency and competition in the home-selling industry.
SUMMARY OF SOURCES
- (1) https://commercialobserver.com/2024/03/industrial-real-estate-more-inventory-2024/
- (2) https://www.nahb.org/news-and-economics/housing-economics/indices/housing-market-index
- (3) https://www.globest.com/2024/03/27/mixed-use-much-more-than-office-retail-residential/
- (4) https://www.nature.com/articles/s41467-024-46548-6
- (5) https://www.msci.com/our-solutions/real-assets/real-capital-analytics
- (6) https://www.federalreserve.gov/newsevents/pressreleases/monetary20240320a.htm
- (7) https://www.globest.com/2024/03/27/spread-between-corporate-debt-and-cre-mortgages-hits-24-year-high/
- (8) https://www.reuters.com/markets/europe/ubs-flags-commercial-real-estate-downturn-top-risk-2024-03-28/
- (9) https://www.cohenandsteers.com/insights/the-commercial-real-estate-debt-market-separating-fact-from-fiction/
- (10) https://www.nbcnews.com/business/consumer/realtor-settlement-affects-homebuyers-sellers-how-explainer-rcna144650

The SVN Regional Office was also named #3 in the nation among all SVN brokerages for 2023.

SVN Vanguard finished #1 in the region and #3 nationally in this year’s SVN National conference in Miami, FL. Following a successful 2022 campaign as the international firm of the year, SVN Vanguard continues to deliver top tier performance for 2023.
In addition, the San Diego County Vista Chamber of Commerce named the SVN | Vanguard North County Office the New Business of the Year.
To compile rankings for SVN’s national conference, SVN International Corp. identifies the top producing brokerages and advisors based upon closed commercial real estate transactions. Top producing Advisors are ranked in three different categories based on their gross commission income (GCI). The categories are: Partner’s Circle, President’s Circle and Achiever Award. Tony Yousif, Director- National Accounts, achieved Partner’s Circle status as one of the top advisors in the SVN network. Cameron Irons, Executive Director at SVN Vanguard, and Senior Vice President, Jon Davis, were also recognized for ranking within the Top 100 Advisors of 2023.
About SVN Vanguard
SVN Vanguard is a full-service commercial real estate office of the SVN brand, comprising over 1,600 commercial real estate Advisors and staff, in more offices in the United States than any other commercial real estate firm and continues to expand across the globe. We believe geographical coverage and amplified outreach to traditional, cross-market and emerging buyers and tenants is the only way to achieve maximum value to our clients. Visit http://www.svnvanguardoc.com for more information.


SHAREABLE FLIPBOOK DOWNLOADABLE PDF


