The Consumer Price Index (CPI) accelerated in June, rising 0.3% from May and 2.7% over the past twelve months, according to the latest data from the Bureau of Labor Statistics (BLS).
Core-CPI, which removes the more volatile food and energy components, also accelerated relative to the past few months, up 0.2% month-over-month and 2.9% annually.
The categories driving price growth in June suggest that the effects of tariffs are beginning to take hold, following several months of seemingly little effect. Prices of items such as appliances and apparel, which have high exposure to tariffs, increased by 1.9% and 0.4%, respectively, on a monthly basis.
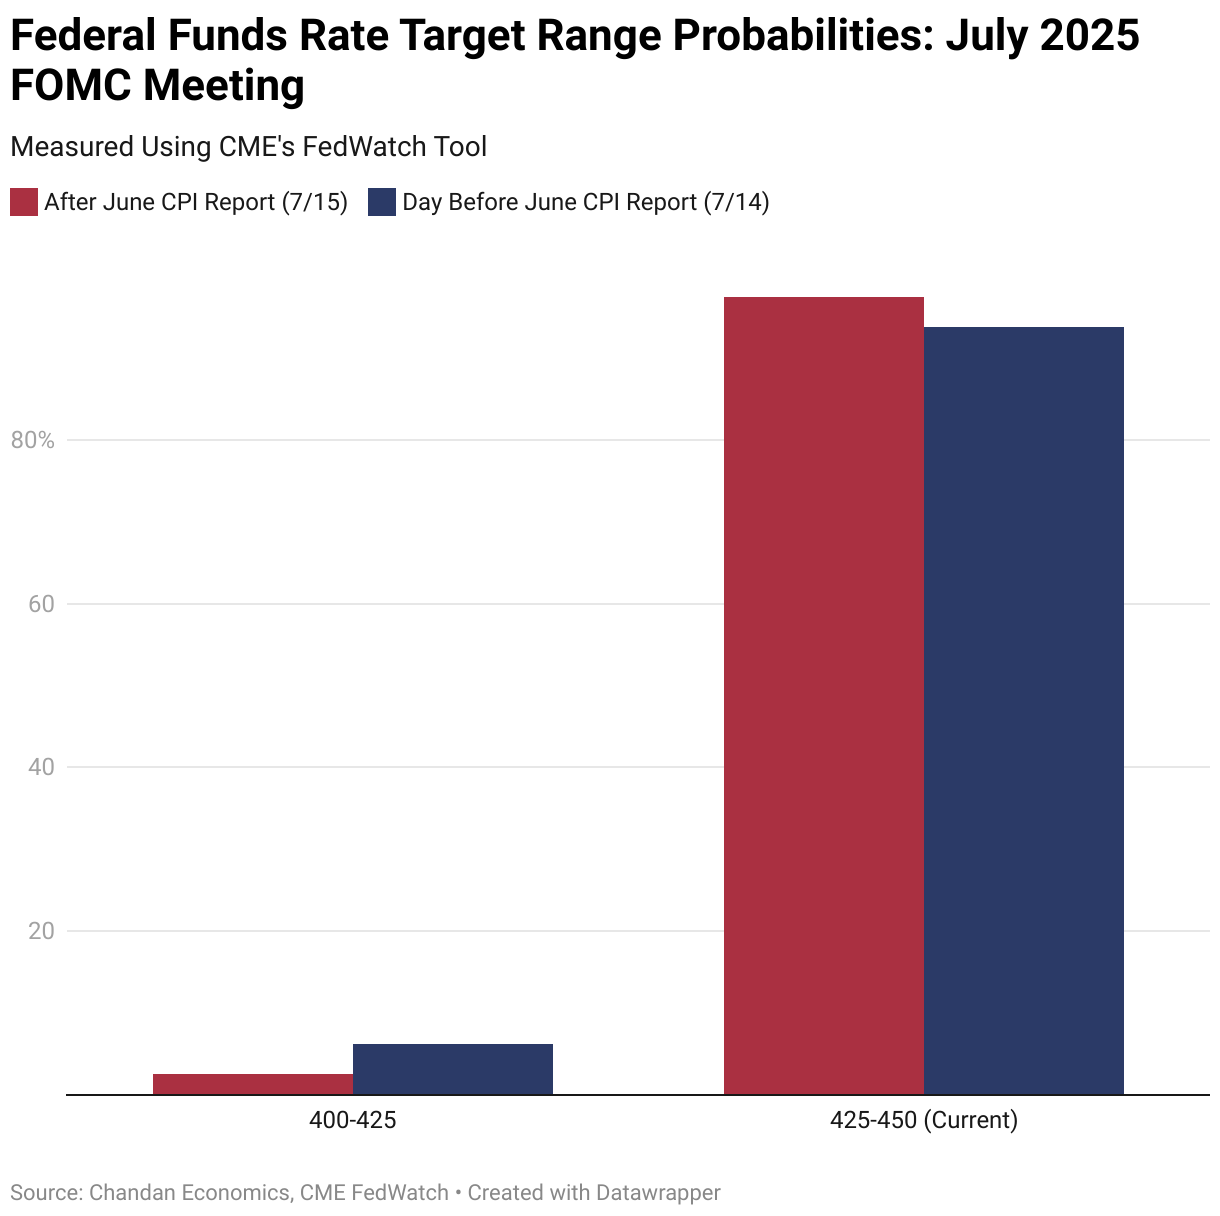
The latest CPI data has reinforced market expectations of no rate cut in July. According to data from the Chicago Mercantile Exchange’s Fed Watch Tool, following the release of the CPI report on July 15, the probability of a July rate cut further dwindled to 2.6% from 6.2% the day before.
Nonetheless, recent dovish concerns from some FOMC officials indicate that they are aware of emerging downside risks to demand, leaving the interest rate outlook potentially vulnerable to sudden shifts.
2. FED BEIGE BOOK
According to the Federal Reserve’s July 16 Beige Book, most districts reported little to no change in overall economic activity, while modest growth was observed in a few regions.
Sectors such as tourism and healthcare remained relatively stable, but others, including manufacturing and transportation, are showing signs of progressive weakness.
Consumer demand remained steady, but firms in some districts report higher price sensitivity to discretionary purchases as of late. Hospitality and travel continue to perform relatively well but are moderating, while discounts are becoming more frequent, and large purchases are facing last demand.
Residential real estate demand weakened in most districts, with slower new construction activity and relatively flat home sales as affordability challenges continue to weigh on buyers.
Commercial real estate softened across most districts, with reports of higher office vacancies and lower demand for new space.
Lending was described as tight with flat loan demand by banking contacts in most districts. Meanwhile, business borrowers are reportedly scaling back investment plans while real estate lending remains largely constrained.
3. NATIONAL RENT COLLECTIONS
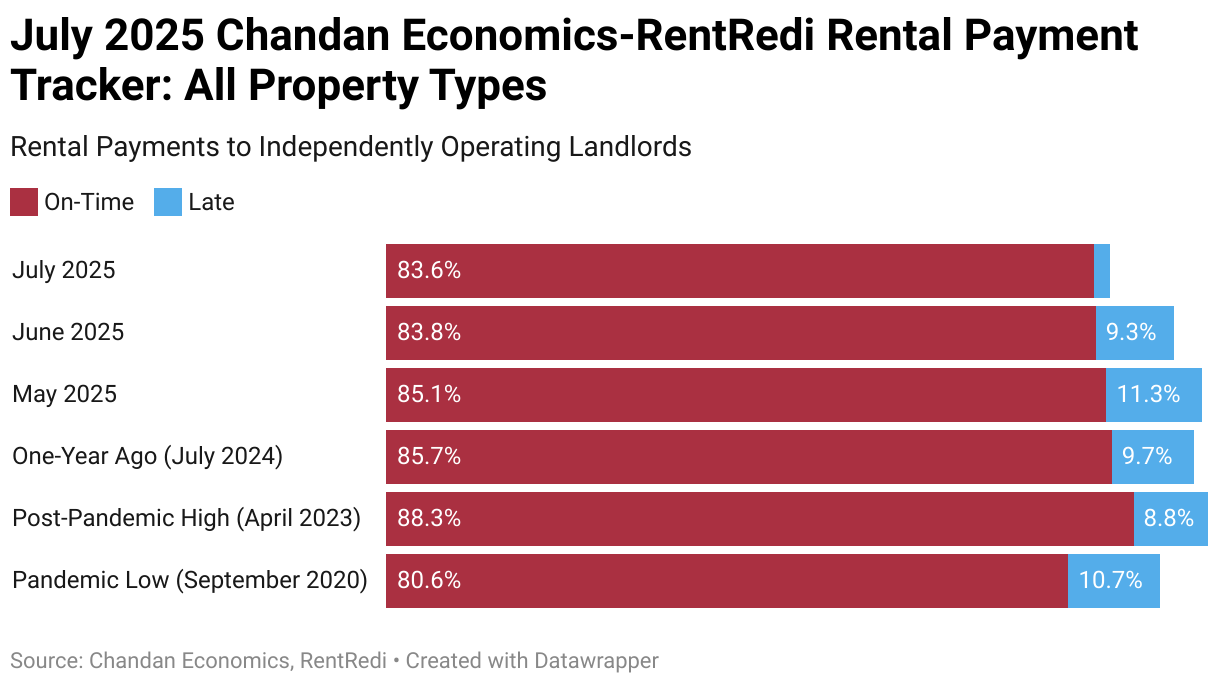
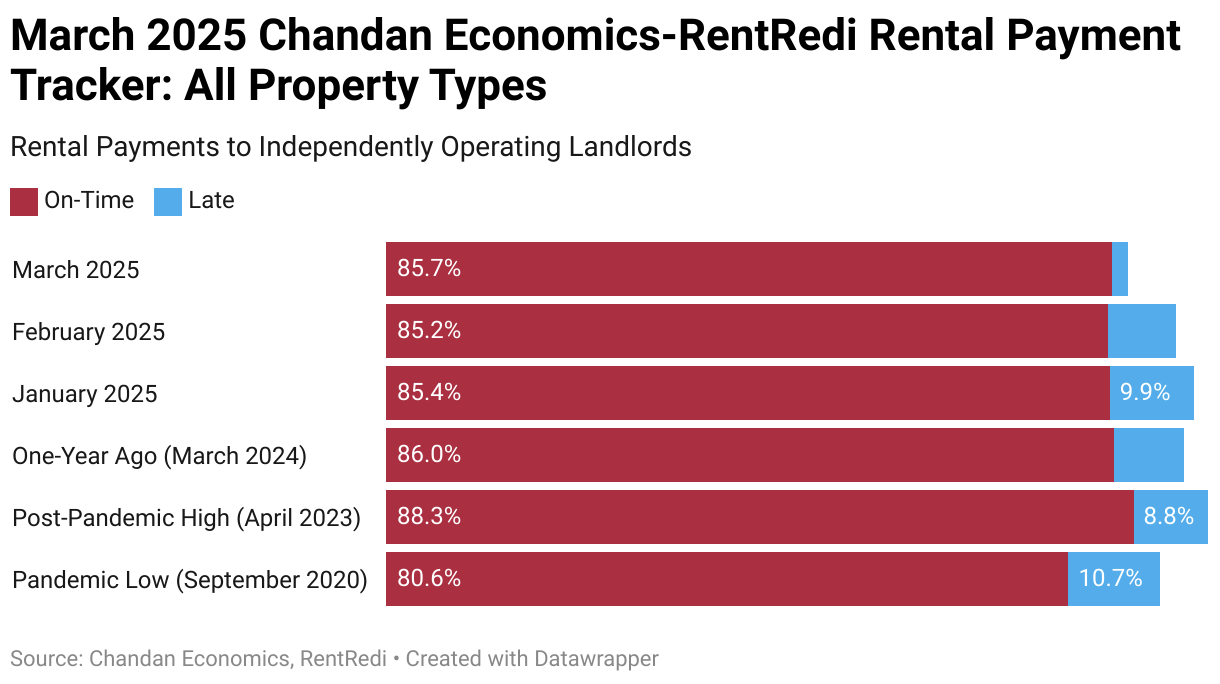
On-time rental payments in independently operated units decreased by 20 basis points (bps) to 83.6% in July, as the metric continues to signal a concerning trend in the financial health of renter households.
June’s on-time payment rate, initially reported at 84.3%, has been revised down to 83.8%. In total, the on-time rate has declined by 229 bps over the past four months, illustrating a sharp performance drop-off.
On-time payment rates have now fallen year-over-year for 24 consecutive months. Compared to a year earlier, the rate is down a sizable 209 basis points — the second-largest annual drop during the post-pandemic era, but an improvement from June.
Western states continue to hold the highest on-time payment rates in the country, led by Idaho (93.5%), Hawaii (92.3%), Alaska (91.6%), Utah (91.2%), and Montana (91.1%).
Compared to one year earlier, Missouri (+617 bps), Alabama (+321 bps), and the District of Columbia (+256 bps) saw the most improvement. Collection rates have deteriorated most in West Virginia (-1002 bps), Vermont (-718 bps), and Massachusetts (-675 bps).
Out of the 50 states, plus the District of Columbia, only 11 saw improvement in on-time payment rates from a year earlier.
4. HOUSING MARKET ACTIVITY
Housing market activity in the US rose slightly in July from a 2.5-year low hit in June, according to the latest NAHB/Wells Fargo Housing Market Index.
Homebuying activity experienced a particularly weak spring in 2025, driven by poor affordability conditions and elevated interest rates. July’s uptick was driven by a modest increase in current sales conditions and sales expectations for the next six months, while the traffic of prospective buyers fell.
Homebuilder discounts continue to be a catalyst for new sales activity, with 38% of builders reporting price cuts in July—the highest share to do so since the NAHB began tracking the metric on a monthly basis in 2022.
This discount-driven sales activity in recent months has raised alarm bells among several housing market watchers, who warn that, absent a cut in interest rates, both housing construction and homebuying activity are likely to continue falling.
5. APARTMENT COMPLETIONS DECLINE
According to recent data from RealPage, nationwide apartment completions fell during Q2 but remain elevated.
Completions totaled roughly 108k units in Q2 2025, down from a peak of 159k units in Q3 2024 but still above pre-2023 levels.
The South of the US remains the most active region for new supply but also experienced the sharpest quarter-over-quarter decline, delivering 6,900 fewer units in Q2 compared to Q1.
All regions have returned to their 2023/2024 highs, but some have shown positive quarter-over-quarter trends. Both the Midwest and Northeast experienced slight upticks from Q1, while deliveries in the West region fell.
On a metro-level, Dallas, New York, Phoenix, and Austin led the nation in competition volume during Q2, each delivering at least 5,000 units.
6. SENIOR HOUSING OCCUPANCY TRENDS
According to a new report from the National Investment Center for Seniors Housing & Care (NIC), despite a growing number of older Americans electing to age in place, seniors continue to move into retirement housing at record rates.
According to the report, the sector’s occupancy rate rose by 80 basis points (bps) to 88.1% between Q1 and Q2 of this year, adding 6,000 units.
Through Q2 2025, rent growth in the senior living sector was 4.1% year-over-year, with some variation by property type. Rents in independent living communities were up 4.25% year-over-year between Q2 2024 and Q2 2025, while those in assisted living communities grew by 3.97%.
As seen in other segments of the rental housing sector, supply is failing to keep up with new demand, pushing rents higher. NIC reports that inventory declined from 1.2% to 1.0% during the first and second quarters, while construction projects slowed, indicating that changing economic conditions and policy developments are key drivers of new caution among developers and capital providers.
7. OFFICE SECTOR VACANCIES
According to Commercial Edge’s most recent National Office Report, the US office vacancy rate was 19.4% in June, 130 basis points higher than in June 2024.
The report highlights sluggish white-collar job growth and recent loan maturities that are exacerbating office growth struggles.
Rents have continued to rise over the past year, with the average listing rate now at $32.87, a 3.8% increase in the last 12 months.
According to Yardi, an affiliate of Commercial Edge, approximately 14,000 highly leveraged office properties have recently matured or will mature by the end of 2026, accounting for roughly 33% of all office loans.
Many borrowers have utilized loan extensions as they approach maturity as a way to buy time and await better market conditions; however, lenders are expected to reduce the availability of loan extensions moving forward.
Among the largest US office markets, Atlanta-based office properties have the highest share of loans maturing in the next two years (50.5%), followed by Denver (49.0%), Bridgeport-New Haven (CT) (48.5%), Chicago (46.0%), and Minneapolis-St. Paul (41.2%).
8. H1 2025 FORECLOSURE ACTIVITY
According to ATTOM, during the first half of 2025, foreclosure filings in the US were 5.8% higher than over the same period in 2024.
A total of 187,659 properties filed for foreclosure during H1 2025 compared to 177,431 in H1 2024. Still, while the first-half totals for 2025 are the highest in any similar period since 2019, foreclosure activity remains low by historical standards. For context, a 2010 peak saw over 1.6 million foreclosures during the first six months of the year.
Nonetheless, the recent persistent rise in foreclosures signals that some homeowners are still facing financial challenges amid today’s housing and economic landscape.
States that saw the most significant increases in foreclosure starts during H1 2025 were Texas (+17,680), Florida (+15,198), California (+14,751), Illinois (+7,922), and New York (+6,585).
More recently, 21,782 US properties initiated the foreclosure process in June 2025, a 10 percent decrease from the previous month but a 17 percent increase from June 2024.
9. CONSUMER BEHAVIOR TRENDS IN RETAIL AND DINING
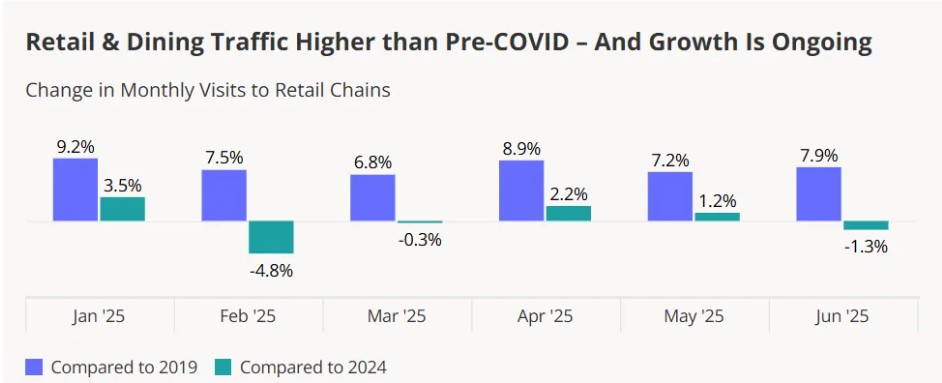
A recent analysis by CRE Daily shows that retail and dining traffic now exceed pre-pandemic levels, though office visits remain 33% below 2019, evidence that some pandemic-era changes to consumer activity were permanent.
In June 2025, the number of visits to retail chains was 7.9% higher than the same period in 2019, although it was 1.3% lower than June 2024 levels. Still, this far into 2025, each month has seen a higher volume of in-store activity relative to its 2019 comparison.
The analysis suggests one of the key trends driving retail traffic is a growing consumer willingness to visit multiple chains for specific products. A fragmentation of shopping habits has left more niche and limited-supply grocers as beneficiaries.
Furthermore, discounters have experienced a 30% increase in traffic since 2019, with year-over-year growth continuing to rise.
Mid-market retailers are the biggest losers of post-pandemic shifts. Excluding off-price apparel stores, traffic to apparel stores during H1 2025 was 19.7% below H1 2019.
Meanwhile, luxury apparel stores have gained grown. Traffic to luxury retailers was up 7.6% in H1 2025 compared to H1 2019.
10. RETAIL SALES
US retail sales rose 0.6% month-over-month in June, following declines in April and May, according to the latest data from the US Census Bureau. The June results beat market expectations of 0.1% growth.
The largest monthly increases were in sales at miscellaneous store retailers (+1.8%), motor vehicles and parts stores (+1.2%), building material and garden equipment stores (+0.9%), and clothing stores (+0.9%).
Furthermore, sales used to calculate GDP, which are retail sales excluding food services, auto dealers, building materials, and gas stations, increased by 0.5% on a monthly basis.
Sales at gas stations remained flat, while sales at furniture and electronics stores each declined by 0.1%.
On June 18th, the FOMC held interest rates unchanged at 4.25-4.50%, a widely expected decision leading into the meeting.
According to the committee’s statement following the meeting, officials observed swings in net export activity but viewed expanding economic activity as sufficient to justify continuing to hold rates steady for now.
Officials noted that the unemployment rate remains low by historical standards, labor market conditions remain solid, while inflation remains somewhat elevated.
The Fed continues to adopt a wait-and-see approach to interest rate policy, waiting to assess the potential impact of tariffs on prices and the health of the labor market.
2. FOMC ECONOMIC PROJECTIONS
Despite noting sustained elevated uncertainty in the economic outlook, policymakers, on average, continue to pencil in two additional rate cuts before the end of 2025.
Nonetheless, the average member forecast for interest rate moves in 2026 and 2027 has been reduced to just one 25-basis-point cut each year.
Members revised their forecast for 2025 Real GDP growth to 1.4% compared to 1.7% in March. The projection for 2026 was revised down from 1.8% to 1.6%. The outlook for 2025 growth was unchanged at 1.8%.
The unemployment rate is now expected to finish at 4.5% in both 2025 and 2026, slightly higher than in the March release.
PCE inflation is expected to finish at 3.0% by the end of the year, compared to a forecast of 2.7% in March, before reaching 2.1% by the end of 2027.
3. NATIONAL RENT PERFORMANCE
According to the Chandan Economics-Rent Redi, June 2025 Rent Collections report, on-time rental payments in independently operated units dropped meaningfully from May, declining 85 basis points (bps) to 84.3%.
May’s on-time payment rate was revised down to 85.2% from an initially reported 85.5%. In total, the on-time rate has declined by 154 bps over the past three months and has declined year-over-year for 23 consecutive months.
Western states continue to hold the highest on-time payment rates in the country, led by Montana, Utah, Hawaii, Alaska, and Idaho.
2-4-family rental properties rentals held the highest on-time payment rates in June, coming in at 84.6%
Altogether, national rent collection trends indicate that more US renters are struggling to meet their monthly financial obligations, with late payments accelerating more rapidly among younger and lower-income renters.
4. FORECLOSURES FALL
According to ATTOM’s May Foreclosure Report, housing foreclosures decreased by 1.0% in May but remained 9.0% higher over the past year.
The report noted a mixed picture, where fewer foreclosure starts occurred alongside a continued rise in completed ones.
Delaware, Florida, and Illinois posted the highest foreclosure rates in May. Among the top 100 metros, three Florida markets —Lakeland, Cape Coral, and Jacksonville —registered the highest number of foreclosures.
Meanwhile, foreclosure starts increased the most in Texas, Florida, and California, respectively. Nationwide, one in every 4,009 housing units had a foreclosure filing in May.
5. MARKETS MOST EXPOSED TO FEDERAL JOB CUTS
According to a recent analysis by Chandan Economic, while residential and office demand in Washington D.C. stands to be most affected by federal government job cuts, smaller metros with less diverse economies, such as Anchorage, Honolulu, and Charleston (SC), may also be strongly impacted.
Housing inventory in the D.C. area has already climbed substantially during the first half of 2025, up 44.8% year-over-year compared to a nationwide average of 32.5%, according to Altos.
However, compared to relatively smaller and more isolated metros, such as Anchorage and Honolulu, D.C. has a more diversified industry base and is positioned along the nation’s Northeast Corridor—a key engine of economic activity.
While pro-growth elements of the Budget Reconciliation package, which is poised to enact steep federal budget cuts, may spur private investment in these regions, such investments could take time to materialize.
6. POTENTIAL SECTORS FOR OFFICE DISTRESS BUYS
A recent analysis by Trepp suggests that the persistent challenges of the US office sector are slowly opening new opportunities for distressed buys.
Utilizing a nationwide search of office assets with outstanding CMBS loans property and occupancy rates at or below 60%, the analysis identified 279 properties with a total outstanding balance of $9.02 that are potentially strong candidates for distressed buys.
Roughly $3.02 billion of the potential candidates were built before 1940, while another $4.71 billion carry a DSCR of 0.89x or lower, which signals high financial stress for the property.
$6.6 billion of the loans are priced between 3.50% and 5.49%, leaving current borrowers exposed to refi-risks in a higher-rate environment.
Geographically, the New York City metro represented $2.36 billion, or 26%, of the potential properties observed in the survey.
7. MARKETS WITH TOP RENT GROWTH POTENTIAL
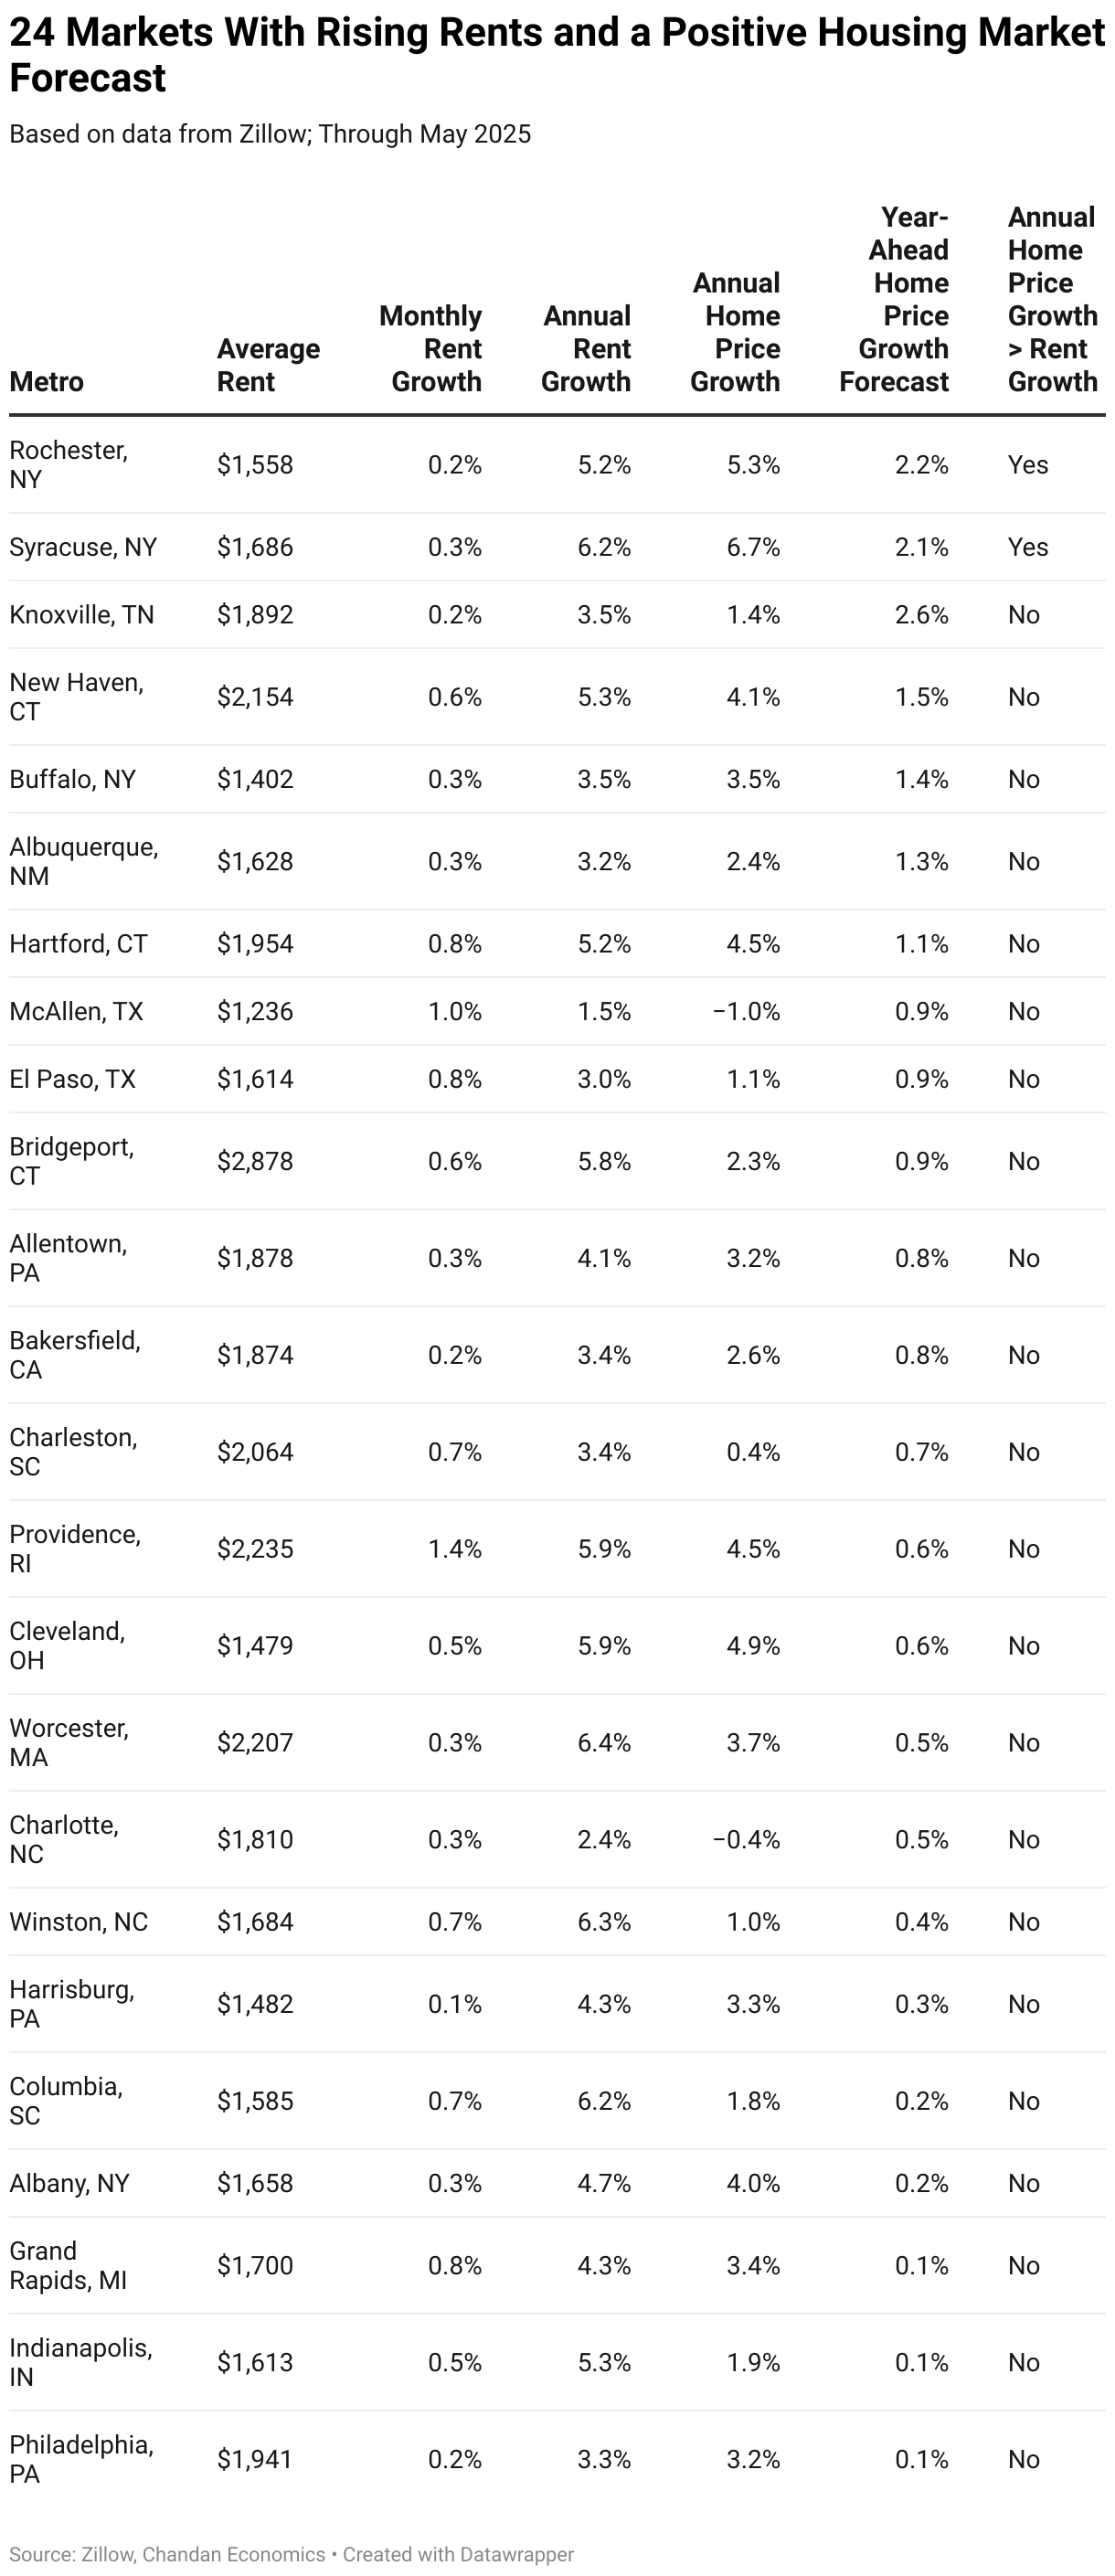
According to an analysis by Chandan Economics, among the nation’s top 100 metros, Rochester, NY; Syracuse, NY; and Knoxville, TN, lead markets where rent growth has the most potential to increase over the coming year.
The analysis used a model based on the differential between annual home price growth and rent growth, forecasts for year-ahead home price growth, and recent month-over-month changes to rent prices.
Rochester and Syracuse’s rankings were driven by relative affordability, tight housing supply, and steady population retention. Home prices continue to rise faster than rents in the Empire State metros, signaling that there is room for growth in their rental sectors in the coming year.
Metros like Knoxville, Providence (RI), and Philadelphia rank high due to rising rents and an optimistic home price forecast. Knoxville ranks highest among surveyed metropolitan areas in projected home price increases, according to Zillow’s housing market forecast.
8. BUILDER CONFIDENCE
Builder confidence fell slightly in June, according to the latest Housing Market Index by the NAHB and Wells Fargo.
The survey, which focuses on the pulse of construction activity in the single-family housing market, showed that current sales conditions fell from May, while sales expectations for the next six months also declined. The traffic of prospective buyers also fell slightly.
Perhaps most notably, 37% of builders reported cutting prices in June, the highest percentage since the survey began tracking the share monthly in 2022. The average price reduction for these properties was 5% in June, a figure that has remained roughly consistent since the end of 2024.
9. CONSUMER CONFIDENCE
According to the Conference Board, consumer confidence dropped in June, reversing a sharp uptick in May, with both current and medium-term expectations falling.
Consumers were less optimistic about current business conditions. The average assessment of job availability weakened during the month but remained in growth territory, potentially an early signal ahead of the upcoming Job Openings and Labor Turnover Survey (JOLTS) in July.
The expectation index, which measures consumers’ outlook for future income, business, and labor market conditions, declined to an index level of 69.0, well below the typical recession indicator of 80.
10. RETAIL SALES
According to the Census Bureau, US retail sales declined 0.9% month-over-month in May, following a revised 0.1% decline in April. Sales were worse than the market forecast of a 0.7% drop.
The monthly decline was its largest in four months and could represent a pull-back by consumers ahead of expected tariffs or a deterioration in spending ability.
Sales at motor vehicle and parts stores fell steeply, dropping 3.5% from April.
Building material and garden equipment stores experienced the second-largest decline in any sector, falling 2.7%, followed by gas stations, which dropped 2.0%.
The meeting minutes from the FOMC’s May 6-7 policy meeting show that officials see increased recession risks in the wake of tariffs, arguing that a recession is now “almost as likely” as their baseline forecast of low GDP growth for 2025.
Officials held rates unchanged at their May meeting as they wait to see where their most considerable policy risks develop, with the risks of both price stability and labor market deterioration hanging in an uncertain balance.
Meeting participants warn that they may face “difficult tradeoffs” if inflation proves to be more persistent than anticipated while the US growth outlook deteriorates. They note that economic uncertainty had increased relative to their last policy meeting, justifying their continued wait-and-see approach to rate changes.
While labor market indicators continue to prove resilient, officials note that the risk of short-term deterioration in the labor market has increased in recent months and that the outcome will heavily depend on how proposed trade and fiscal policies develop.
Officials expressed that they would be willing to amend their “wait-and-see” approach if tariffs worsen inflation pressures enough to weaken labor market fundamentals.
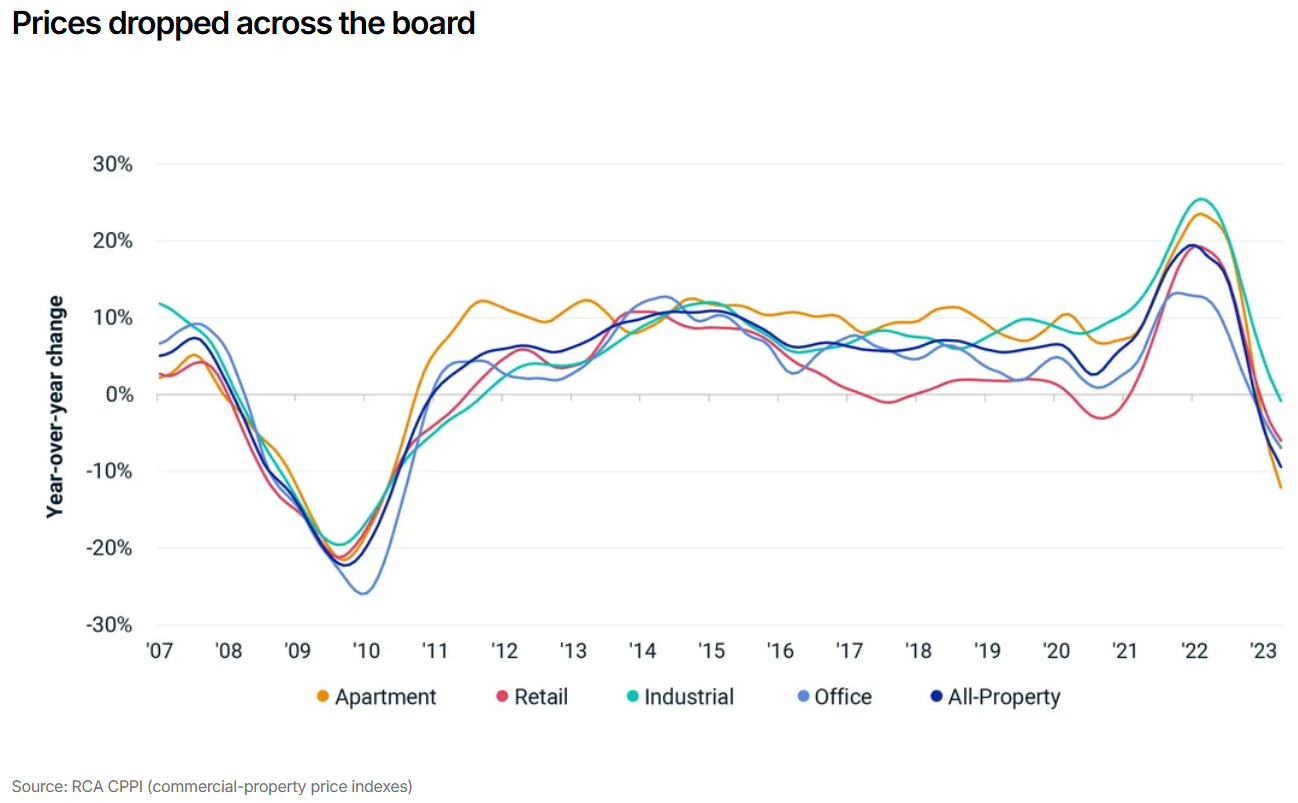
2. COMMERCIAL PROPERTY PRICES
According to MSCI Real Capital Analytics, Commercial property prices fell by 0.4% from March and are down 0.4% year-over-year through April.
Retail prices recorded the strongest performance of all property types, rising 0.7% month-over-month, its 11th consecutive month of price growth. Retail prices are up 4.2% year-over-year.
Meanwhile, Industrial properties, which were once the leading sector for price momentum during the post-pandemic period, have seen price activity continue to decelerate. Industrial properties fell 0.4% month-over-month and are just up 0.4% from one year ago.
Apartment prices similarly fell by 0.4% from March and are down 1.0% from one year earlier. Nonetheless, the annual pace of price declines for Apartment properties has been steadily easing since late 2023.
Office properties continue to gradually stabilize, with overall prices climbing 0.6% from April while remaining down by 0.3% year-over-year. Drilling down further, prices for offices in central business districts (CBDs) climbed 0.1% on the month and are down by 3.8% from one year ago. Suburban office prices rose 0.7% from March and are up by 1.0% year-over-year.
According to the report’s analysis, deal volume remains mostly on par with the same time a year ago, suggesting that price declines don’t necessarily reflect recent increases in US economic uncertainty.
3. Q1 TRANSACTION AND INVESTMENT ACTIVITY
According to Altus Group’s Q1 Commercial Real Estate (CRE) Transaction and Investment Activity Report, the US CRE market registered $69.3 billion in dollar value transacted, down from $89.2 billion in Q4 to 2024.
The total number of properties transacted also fell, declining by 11.6%, but remains above pre-pandemic levels.
According to the analysis, transaction activity showed signs of strength, with prices in the Multifamily and Office sectors climbing higher despite a relatively subdued market.
Twelve of the 15 property sub-sectors tracked by Altus Group increased in price per square foot on a quarter-over-quarter basis, with particular strength in consumer-facing categories such as big-box retail and hotels.
4. CBDS: PRICE MOMENTUM DESPITE HIGH VACANCIES
According to Commercial Edge’s latest Office Market Report, listing rates for office properties in central business districts (CBDs) continue to climb despite the persistence of high vacancies and discounted sales.
The average listing price for US office properties was $33.34 per square foot in April, the latest month of data availability, rising 5.4% year-over-year despite relatively weak demand.
The national CBD office vacancy rate stood at 12.9% in April, a 7.3 percentage point increase since 2020 as new office demand begins to favor suburban locations.
Notably, in April, President Trump signed an executive order that revoked previous directives that prioritized CBDs when selecting sites for new federal office leases. The directive, combined with the existing momentum towards suburbia in private markets, could further weaken demand in downtown areas.
According to the report, new office inventory in CBDs fell 42% year-over-year to just under four million square feet in 2024, its lowest total since 2016. Overall office inventory fell 47 to million square feet, a 10-year low, with CBD growth making up just 8.2% of the total.
5. HOUSEHOLD SPENDING GROWTH FALLS
According to the New York Fed’s Survey of Consumer Sentiment, household spending growth declined during April, the latest month available, primarily due to a decrease in large-dollar purchases.
Household spending unadjusted for inflation rose by 4.5% year-over-year through April — 10 basis points lower than the previous annual growth reading taken in December 2024. However, growth remains well above pre-pandemic levels.
The decline was driven by households earning over $100,000 per year, with the most significant spending decreases centered on large purchases, including electronics, home appliances, furniture, homes, vehicles, and vacations. Spending on home repairs rose.
6. CONSUMER CONFIDENCE IMPROVES
According to data released by the Conference Board on May 27th, US consumer confidence edged higher in May following five consecutive monthly declines.
The “Present Situation” component of the index, which measures consumers’ assessment of current business and labor market conditions, rose slightly and remains well above the recession threshold.
Meanwhile, the “Expectations Index,” which looks ahead at the short-term outlook for income and labor, surged on the month but remained within the recession-indicating range of below 80.
The Conference Board numbers diverge from the more pessimistic preliminary sentiment data released by the University of Michigan earlier in the month. Importantly, however, about half of the responses in the latest Conference Board Survey were collected after the Trump Administration’s May 12th announcement of a pause on some tariffs, illustrating a more up-to-date picture.
Nonetheless, the Conference Board notes that some of the rebound was visible in the data prior to the May 12th pause and was broad-based across all age and income groups.
7. BUILDER SENTIMENT FALLS
According to the NAHB/Wells Fargo Housing Market Index (HMI), builder sentiment fell in May to its lowest level since November 2023 and arrived well below forecasts.
The HMI, where a number over 50 indicates more builders view sales conditions as good than poor, fell six points to 34, firmly in contraction territory.
The current sales conditions index, a sub-component of the HMI, dropped eight points to 37. Meanwhile, sales expectations for the next six months fell one point to 42. The sub-component measuring the traffic of prospective buyers fell two points to 23.
34% of builders surveyed reported dropping final sales prices during May, up 29% from April and the highest share since December 2023. The average reduction for those who cut prices during May was 5%, unchanged from April.
8. HOUSING FORECLOSURE ACTIVITY
According to ATTOM’s National Foreclosure Activity Report, the US housing market continued to experience an annual increase in foreclosures during April, recording roughly 36,000 total foreclosure filings, which is a 0.4% increase from March. Foreclosure filings are up 13.9% year-over-year.
Foreclosure activity remains below historical levels, but the recent momentum reflects increased economic pressures on some homeowners.
Foreclosure starts rose 0.8% from March and are up 16.1% year-over-year. Meanwhile, completed foreclosures declined slightly month-over-month but are up 23.3% from April 2024.
On the state level, South Carolina (one in every 2,311 homes), Illinois (one in every 2,404 homes), and Florida (one in every 2,526 homes) registered the highest foreclose rates.
9. INDEPENDENT LANDLORD RENTAL PERFORMANCE
According to the Chandan Economics-Rent Redi Independent Landlord Rental Performance report, the on-time payments rate in independently operated rental units fell by 15 basis points (bps) in May, sliding to 85.5%.
April’s on-time payment rate, initially reported at 86.3%, was revised down to 85.7%. In total, the on-time payment rate has declined by 28 bps over the past two months and has fallen year-over-year for 22 consecutive months.
The forecast full-payment rate held steady at 94.6%, which is down 298 bps from the post-pandemic peak
Western states continue to hold the highest on-time payment rates in the country, led by Utah, Colorado, Washington, Idaho, and Montana.
Two- to four-family rental properties held the highest on-time payment rates in May, coming in at 86.2%. Single-family rentals (SFR) followed next with an on-time payment rate of 85.8%. Holding up the rear are multifamily properties with an average on-time collection rate of 85.1%.
10. RETAIL SALES
US Retail Sales climbed 0.1% month-over-month in April, following an upwardly revised increase of 1.7% in March, according to the latest estimates from the US Census Bureau.
April’s modest monthly gain following March’s surge suggests two things. First, March’s surge included at least some pull-forward demand, as many consumers accelerated their purchases in anticipation of tariffs and their potential price impact. Second, consumers scaled back their activity in April, either out of concern for tariffs or because they had already accelerated their purchases.
The largest monthly increases in sales were recorded in food services and drinking places (+1.2%), building materials and garden equipment dealers (+0.8%), furniture stores (0.3%), and electronics and appliance stores (0.3%).
The largest month-over-month declines were observed in sporting goods and hobby stores (-2.5%), miscellaneous retailers (-2.1%), gas stations (-0.5%), and clothing stores (-0.4%).
The Conference Board’s US Leading Economic Index (LEI) fell by 0.7% in March, pointing to slowing economic activity in the near term.
March’s decline coincided with soaring economic uncertainty ahead of tariff announcements. Consumer expectations fell, and stock prices experienced their largest monthly decline since September 2022.
The Conference Board stresses that its index does not suggest an impending recession but revised its 2025 US GDP forecast to just 1.6%.
2. CONSUMER SENTIMENT
According to data from the University of Michigan, US consumer sentiment plummeted in April from an index level of 57 in March to 50.8, its lowest since June 2022.
It was the fourth consecutive monthly decline in consumer sentiment, while the index has contracted more than 30% since December.
Moreover, a sub-index of the survey that zeros in on consumers’ short-term expectations fell to its lowest since May 1980.
Growing concerns about the trade war and elevated economic uncertainty, two forces that have reached a crescendo in recent weeks, are driving the decline.
According to the survey’s researchers at the University of Michigan, the latest survey results contained several potential recessionary signals, with consumers reporting falling expectations for business conditions, personal finances, incomes, inflations, and the labor market.
3. BEIGE BOOK
The seal of the U.S. Federal Reserve Board of Governors across the street from the Marriner S. Eccles Federal Reserve building in Washington, D.C., U.S., on Sunday, Dec. 19, 2021. The Federal Reserve chair has tempered his ambition to restore the labor market to its pre-pandemic strength, as the central bank confronts surging inflation and a workforce still constrained by Covid-19. Photographer: Samuel Corum/Bloomberg via Getty Images
According to the Federal Reserve’s latest Beige Book summary of economic activity, economic activity was mostly flat during the six weeks ending on April 14th, 2025, with just five Fed Districts reporting even slight growth.
Trade policy uncertainty was a dominant theme in the beige book, affecting everything from hiring to capital planning. Tariffs are already pushing firms to change how they price, hire, and forecast.
Consumer spending softened during the period, while the Multifamily sector drove commercial real estate activity.
Manufacturing was mixed, while labor markets appeared to be stalling out as headcounts fell in sectors tied to government and nonprofits. Wages are still rising but at a slower pace.
4. DURABLE GOODS
New orders for manufactured durable goods soared in March, rising 9.2% month-over-month to $315.7 billion. It is the third consecutive monthly increase in purchases and far exceeded market expectations of 2%.
The significant increase is likely a lagging signal as firms rushed planned orders of transit-related goods amid rising short-term economic uncertainty.
Purchases of commercial aircraft drove the uptick, with transportation equipment orders up 27.0%. Outside of transportation equipment, new orders were mostly flat.
Orders for non-defense capital goods, which serves as a proxy for business spending plans, ticked up slightly by 0.1% in March, rebounding from a 0.3% fall in February.
5. RETAIL SALES
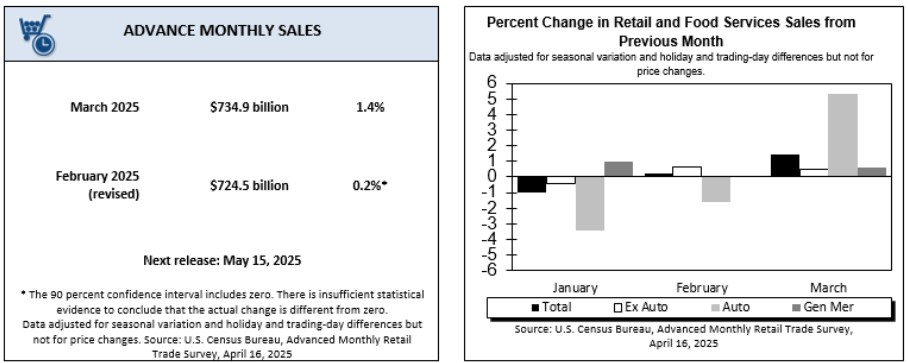
US retail sales climbed 1.4% month-over-month in March, performing slightly better than forecasts. It was the highest increase in retail sales since January 2023, but the surge may reflect pull-forward demand from rising trade and economic uncertainty.
A rapid increase in consumer buying activity drove a 5.3% increase in motor vehicle and parts sales. Excluding autos, retail sales rose just 0.5%.
Other significant increases include purchases of building materials and garden equipment (+3.3), sporting goods and hobby stores (+2.4%), and food services and drinking places (+1.8%). Sales declined at gas stations (-2.5%) and furniture stores (-0.7%).
6. COMMERCIAL PROPERTY PRICES
According to Green Street’s Commercial Property Price Index, commercial-wide property prices rose 0.3% in March and were essentially unchanged during the first quarter. The index is up 4.9% over the past twelve months.
Industrial transaction price growth led the major property sectors in March, rising 1.0%, while Health Care (+1.3%), Mall (1.0%), and Strip Retail (+1.0%) led secondary sectors.
Over the past 12 months, Apartment transaction prices lead major property sectors, up 12%, while Mall leads secondary sectors, up 15%.
Office transaction prices fell by 2.0% in March, as did Self-Storage. Over the past twelve months, Self-Storage transaction prices have had the steepest declines, down 5.0%, followed by Lodging, down 4.0%.
7. NEW RESIDENTIAL CONSTRUCTION
Housing construction starts in the US plummeted 11.4% month-over-month in March to a seasonally adjusted annualized rate of 1.32 million, its lowest annualized projection in four months.
The fall in housing starts during March was the biggest in a year and followed a 9.8% surge in February.
Single-family housing starts fell 14.2% to an annualized rate of 0.94 million. Multifamily housing starts were unchanged at an annualized rate of 0.37 million.
Regionally, housing starts fell in the West (-30.9% to a rate of 0.28 million) followed by the South (-17.1% to a rate of 0.67 million). Starts rose in the Midwest (76.2% to a rate of 0.22 million) and the Northeast (1.4% to a rate of 0.140 million).
8. INDEPENDENT LANDLORD RENTAL PERFORMANCE
According to Chandan Economics-RentRedi Independent Landlord Rental Performance Report, the on-time payment rate in independently operated rental units jumped by 45 basis points (bps) to 86.3% In April 2025
Compared to a year earlier, on-time payments are up slightly — by eight (8) bps. April’s year-over-year improvement breaks a twenty-month streak of annual collection rate declines.
The forecast full-payment rate, which includes on-time payments, late payments, and expected late payments based on historical trends, slid slightly to 95.5% — dropping 26 bps from March. Despite the month-over-month decline, April’s full payment forecast is the second highest in the past six months.
Western states continue to hold the highest on-time payment rates in the country, led by Utah, Idaho, Alaska, Wyoming, and New Mexico.
2-4-family rental properties rentals held the highest on-time payment rates in April, coming in at 87.0%.
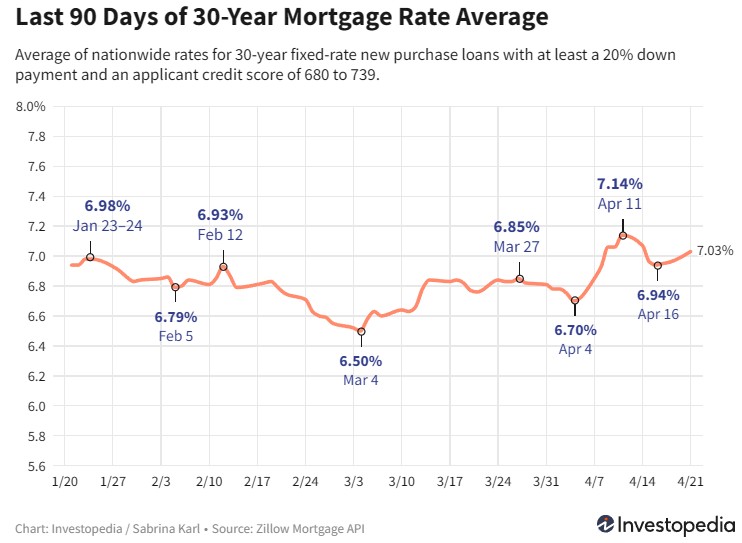
9. MORTGAGE RATES RISE, DEMAND FALLS
Recent treasury market volatility has induced dramatic swings in mortgage rates, with the average contract rate on a 30-year fixed-rate mortgage hitting as low as 6.70% and as high as 7.14% across just a (7) day period in April.
For context, mortgage rates have been elevated for the past two-plus years as the Federal Reserve hiked interest rates in response to inflation. Then, 30-year rates took a historic plunge in September as the Fed pivoted to rate cuts, reaching as low as 5.89% and building the market’s anticipation for looser financial conditions.
However, by late January, the average 30-year rate was back above 7.0% and has largely remained elevated since, as concerns over the fiscal deficit and the inflationary threat of potential tariffs became more front-of-mind for markets
Early April’s mortgage rate volatility is indicative of the on-and-off nature of US tariff announcements and simultaneous reactions by the bond market, which appears to be pricing in an elevated risk to the US economy. Further, strong job growth in March has lowered the probability of a Fed rate cut in May, keeping a higher floor on mortgage rates.
10. TOP MARKETS FOR RENTAL OCCUPANCY
Grand Rapids, MI, charts the tightest rental market in the US, while the other four (4) of the top five (5) are all located in the New England Region, according to a new analysis by Chandan Economics, in partnership with Arbor Realty Trust.
The Grand Rapids rental sector is 99.2% occupied, the highest tally across the nation’s top 75 metros. It is followed by Bridgeport, CT (98.6%); Hartford, CT (98.5%), Providence, RI (98.3%), and Boston, MA (98.1%).
Meanwhile, Columbia, SC, and Memphis, TN, had the largest year-over-year improvements in occupancy levels.
Apartment vacancies rose on a national level compared to one year ago. Still, occupancy increased in 36 of the top 75 markets last year while exceeding 95% in nearly one-third.
US Consumer Confidence dipped sharply in March, according to the Conference Board’s latest numbers.
The index fell 7.2 points to 92.9, its fourth consecutive monthly decline and lowest reading since January 2021. The reading fell short of expectations.
Consumers’ increasing concerns about their financial futures are weighing down on the index as the measure of Americans’ short-term expectations for income, and the job market is now at its lowest level in 12 years.
The present-situation part of the index remains higher but is also on a downtrend as consumers signal increasing anxiety over tariffs and inflation.
The Conference Board notes that the metric of short-term expectations is well below the recession-indicating threshold of 80. Meanwhile, the share of US consumers anticipating a recession sits at a nine-month high.
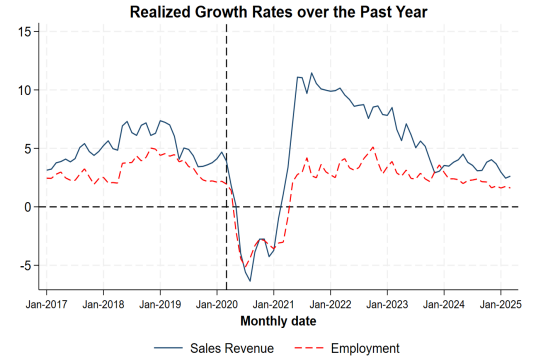
2. BUSINESS UNCERTAINTY
The Atlanta Federal Reserve’s latest monthly survey of business uncertainty shows that sales revenue growth expectations have risen recently, but firms remain more uncertain about future sales growth than they were prior to the pandemic.
The panel of senior finance and managerial professionals has reported considerably slower nominal sales growth over the past two years. The past several months have seen a modest revival of sales growth expectations. However, elevated uncertainty leaves current forecasts on a shakier footing than estimates made under less volatile economic conditions.
Expectations around year-ahead employment growth have similarly improved, while uncertainty about unemployment growth has returned to pre-pandemic levels. As of March, most firms don’t foresee drastic changes to working arrangements over the coming year, with fully in-person employees accounting for 68.1% of full-time workers.
3. FED INTEREST RATE DECISION
Fed policymakers kept interest rates unchanged at their March meeting, holding the federal funds rate at 4.25-4.50%, which was in line with market expectations.
In its post-meeting statement, the FOMC acknowledged that the uncertainty around the economic outlook had increased and that they were attentive to risks on both sides of its dual mandate.
Despite the nod to rising uncertainty, officials affirmed their expectations of reducing rates by an additional 50 basis points (bps) by the end of the year, which, for context, is in line with their December 2024 projection.
The Fed statement highlights that recent indicators show continued economic expansion with a stable unemployment rate and solid labor market conditions. They also noted that inflation remains somewhat elevated and that they will continue to monitor incoming data and its potential implications on the economic outlook.
4. FOMC ECONOMIC PROJECTIONS
The FOMC’s latest Summary of Economic Projections, released during every other policy meeting, cut the median GDP growth forecast for 2025, 2026, and 2027 compared to December while raising forecasts for PCE inflation in 2025 and 2026.
The median real GDP growth forecast for 2025 was cut from 2.1% in the December projections to 1.7% as of the March projections. The real GDP forecast for 2026 was revised down from 2.0% to 1.8%, and 2027 revised from 1.9% to 1.8%.
The median PCE inflation forecast for 2025 was raised from 2.5% to 2.7%. For 2026, the inflation forecast is up slightly from 2.1% to 2.2%. The Committee kept the inflation forecast for 2027 unchanged at 2%.
The unemployment rate is expected to be slightly higher this year at 4.4% compared to 4.3%, but no changes were made for the 2026 and 2027 forecasts, each at 4.3%.
5. NAIOP INDUSTRIAL SPACE DEMAND FORECAST
According to NAIOP’s Q1 2025 Industrial Space Demand Report, in 2024, the Industrial sector experienced its lowest annual rate of net absorption in 13 years.
NAIOP reports that Industrial net absorption in the second half of 2024 totaled 96.9 million square feet, bringing the annual volume to just 170.8, its lowest since 2011.
The report notes that elevated long-term interest rates have been a key reason for slowing space demand.
Analysts forecast that net absorption will slow further during the first half of 2025 to a projected 52.2 million square feet before accelerating in the second half to end the year with a total of 156.4 million square feet absorbed.
In 2026, Industrial net absorption is expected to climb back to 224.9 million square feet as elevated interest rates are expected to gradually normalize, though not return to the low-rate equilibrium of the past decade.
6. FASTEST GROWING CITIES
According to a Business Insider analysis of the recently released 2024 metro-level population estimates by the US Census Bureau, most US metros saw populations increase last year, while Florida metros were among the fastest.
Ocala, Florida (FL) and Panama City, FL, grew by 4.0% and 3.8%, respectively, last year. Meanwhile, Myrtle Beach, South Carolina, aligned with Panama City’s 3.8% growth.
Another notable Florida metro includes Lakeland-Winter Haven, which grew by 3.5%. Provo, Utah, and Daphne, Alabama, were honorable mentions at 3.0% each.
Immigration was key to the growth, with each metro area experiencing positive net international migration during the year.
Notably, cities like Midland and Odessa in Texas, which experienced pandemic-era population declines, were some of the fastest-growing metros in 2024.
7. CO-WORKING SPACES CLIMB 25% IN A YEAR
According to Commercial Edge’s latest National Office Report, co-working locations surged 25% year-over-year through February, coinciding with a 15.2% increase in overall square footage.
Co-working spaces have grown in popularity since the pandemic and are helping to fill a gap in the demand for space by working professionals.
As a percent of total office stock, co-working spaces increased 30 basis points from February 2024 to 2.0% as of the latest tally.
While still a significantly small portion of national office space, co-working’s momentum in individual regions and sectors makes it increasingly important in several local office markets.
The Southeast region of the United States leads in total co-working spaces with 1,960 spaces, up 24.2% year-over-year. The West follows closely with 1,709 spaces and has grown 16.7% in the past year.
In the Northeast, there are a total of 1,422 spaces, which is a 17.5% increase over last February. The Midwest has 1,121 spaces, up 27.7% year-over-year. The Southwest has 999 spaces, up 18.8% year-over-year.
The average size of co-working locations has decreased in the past year, which is expected to continue but mostly reflects the sub-sector’s shift into the suburbs as central business districts gradually normalize.
8. HOMEBUILDER CONFIDENCE
Builder confidence dropped to its lowest level in seven months in March, according to the latest reading from the NAHB/Wells Fargo Housing Market Index.
Both sales conditions and prospective buyer traffic for newly built single-family homes worsened during the month. Sales expectations for the next six months held steady.
According to an NAHB statement following the data release, builders continue to face labor and lot shortages, while tariff issues exacerbate material cost challenges.
Meanwhile, builders are beginning to see regulatory relief, such as in the Administration’s recent pause in the 2021 IECC building code requirement.
9. INDEPENDENT LANDLORD RENTAL PERFORMANCE
According to the latest Chandan Economics-Rent Redi Independent Landlord Rental Performance Report, in March 2025, the on-time payment rate in independently operated rental units jumped by 53 basis points (bps), rising to 85.7%.
This month’s 53 bps jump was the most substantial single period of improvement in on-time rental payments in two years.
Compared to a year earlier, on-time payments are down slightly by a quarter of a percentage point (-25 bps). On-time collection rates have now fallen annually for the past twenty (20) consecutive months. However, the pace of annual increase has meaningfully lessened in recent months
The forecast full-payment rate improved for the second straight month, rising to 94.7%.
Western states continue to hold the highest on-time payment rates in the country, led by Idaho, New Mexico, Alaska, California, and Utah.
2-4-family rental properties and single-family rentals held the highest on-time payment rates in February, coming in at 85.7%.
10. RETAIL SALES
US Retail sales rose 0.2% month-over-month in February, rebounding from a downwardly revised 1.2% decline in January but still below forecasts.
Seven of the report’s 13 categories registered a decline during the month. This included food services & drinking places (-1.5%), gasoline stations (-1%), clothing stores (-0.6%), motor vehicle & parts dealers (-0.4%), sporting goods, hobby, musical instrument, & bookstores (-0.4%), miscellaneous store retailers (-0.3%) and electronics & appliance stores (-0.3%).
Meanwhile, increases were seen in sales at non-store retailers (+2.4%), health & personal care stores (+1.7%), food & beverage stores (+0.4%), general merchandise stores (+0.2%) and building materials retailers (+0.2%).
Annually, US retail sales grew 3.1%, following a downwardly revised 3.9% increase in January.
Discussions are heating up around proposals to extend 100% bonus depreciation deductions on certain business assets as tax-extension negotiations gradually take shape.
The 2017 Tax Cuts and Jobs Act (TCJA) offered 100% bonus depreciation on items such as machinery and equipment from 2018 through 2022 before declining by 20 percentage points annually in each year since.
Some advocate for its extension as a lever to grow the economy and create jobs, while reviews of the policy show mixed results.
Scholarly research on the TCJA-based changes shows that the reforms grew capital investment, particularly in the manufacturing sector.
The Joint Committee on Taxation (JCT) finds that extending the 100% level through 2025 and making it retroactive back to 2023 would reduce federal revenues by $3 billion over ten years.
However, an analysis by the Tax Foundation suggests that while restoring 100% bonus depreciation wouldn’t have significant effects on GDP growth in the immediate term, by 2029, it would add an estimated 0.2% to Real GDP.
2. CONSUMER CONFIDENCE FALLS
US consumer confidence slid in February by its fastest pace since August 2021, based on the latest data from the Conference Board.
The Conference Board numbers align with recent developments in the University of Michigan’s consumer sentiment measure, which fell to a seven-month low last month. Consumers show increasing concern about buying conditions for goods and threats to their purchasing power.
Both the present situation index, which measures current assessments of business and labor market conditions, and the expectations index, which looks at the short-term outlook for business and income, declined.
Notably, the expectations index fell within a ‘potential recession’ threshold of below 80 for the first time since June of last year. Inflation expectations also surged during the month.
Through the end of January, some inflation expectations indicators appeared steady, such as the NY Fed’s Survey of Consumer Expectations, which showed stable expectations compared to one year before.
However, the Conference Board data suggests that expectations have unanchored in recent weeks as price pressures resurge and economic uncertainty mounts.
Some of the culprits may be temporary, such as the rise in egg prices or volatility in energy markets. Therefore, policymakers at the FOMC will be keen to zero in on trends in core inflation expectations to assess potential policy implications.
3. STALLING BUSINESS ACTIVITY
US business activity in the manufacturing and service sectors fell to a 17-month low in February as uncertainty over tariffs and the federal budget boggs down what had been a post-election boost in business confidence.
Observing trends in S&P Global’s flash US Composite PMI Output Index, manufacturing and service output fell to an index level of 50.4 in February, its lowest reading since September 2023. A reading above 50 indicates growth, indicating that the sectors barely expanded this month.
Potentially related to both the drop in the PMI and January’s inflation uptick is consumer activity shifting away from services and back towards goods. The services sector drove much of the decline after contracting for the first time in two years. Meanwhile, manufacturing activity rose to an eight-month high.
During the initial pandemic recovery in 2020, goods spending drove both consumer spending and inflation pressures, but the pandemic reopening shifted much of this momentum to services, contributing to our sustained period of inflation.
It’s unclear whether the apparent shift toward goods reflects the temporary effects of consumers trying to get ahead of potential trade restrictions or if we are seeing the impact of falling borrowing costs on producers amid wage and spending stability. There is likely some mix of the two.
4. SURVEY OF HOUSEHOLD EMERGENCY EXPENSES AND DECISION-MAKING
A quarterly survey by Morning Consult that estimates US households’ confidence in their capacity to absorb emergency expenses found that households grew slightly more confident during Q1 2025 relative to the previous quarter but are less optimistic than one year ago.
44% of US adults believe they could cover potential emergency expenses with cash, up from 43% last quarter but down from 47% in Q1 2024.
The survey replicates the hypothetical approach of the Fed’s annual Survey of Household Economics and Decision-making (SHED) while secondarily measuring real outcomes reported by consumers who have recently experienced emergency expenses.
Interestingly, the latest findings show that those who encountered an emergency expense between $200-$600 were able to cover those expenses at a higher rate relative to how they responded hypothetically.
As US consumer confidence statistics drop, surveys that compare confidence levels to real outcomes add an important layer of analysis.
So far, consumers appear to be faring better than expected, but the Morning Consult survey period spanned from January 22-27, leaving questions about the effects of recent key developments, such as an inflation uptick and stalling business activity.
5. FOMC JANUARY MEETING MINUTES
The recently released minutes from the January FOMC meeting indicate that policymakers are cautious about the current high level of uncertainty in the economy as they chart their course for monetary policy adjustments.
The meetings showed that many participants suggested that the committee maintain restrictive policy rates if inflation stays hot amid a largely robust economy.
Conversely, several officials also indicated an inclination to ease rates if labor market conditions weakened, economic growth slowed, or core inflation returned to 2% more quickly.
Meeting participants noted upside risks to inflation, such as potential shifts in trade and immigration policies, geopolitical disruptions to supply changes, and stronger-than-expected household spending.
6. DECLINING BUILDER SENTIMENT
According to data from the National Association of Home Builders (NAHB)/Wells Fargo Housing Market Index, home-builder confidence fell sharply in February, reaching its lowest level in five months.
According to NAHB Chairman Carl Harris, builders remain hopeful of the prospect of pro-development policies such as regulatory reform, but rising uncertainty is currently dampening expectations for 2025.
Trade factors again play a role. NAHB points out that 32% of appliances and 30% of softwood lumber comes from imports. The association notably penned a letter to the Trump Administration earlier this month requesting a pause or carve-outs to the proposed tariffs.
In more positive news, the survey also shows that 26% of builders slashed home prices in February, down from 30% in January and the lowest share since May 2024. However, the average rate of price reduction remains consistently around 5%.
7. HOUSING STARTS DROP
Housing starts dropped 9.8% month-over-month to an annualized 1.36 million units in January, down from a 10-month high of 1.51 million in December. January’s performance missed market forecasts of 1.4 million annualized units.
Severe snowstorms and freezing temperatures disrupted construction activity in much of the country, while rising costs of imports and mortgages impeded any potential rebound.
Single-family home starts declined by 8.4% monthly, while multifamily starts fell by a steeper 11.0%.
Most regions saw starts fall, occurring most significantly in the northeast, down 27.6% from December. The South fell 23.3%, while the Midwest fell 10.4%.
8. CRE CAP RATES RISE
According to a recent CRED iQ analysis, cap rates in the CMBS shifted towards the end of 2024, with several property types rising on a quarter-over-quarter basis in Q4.
Office cap rates averaged 7.40% in Q4, up from 7.16% in Q3. Multifamily rates sat at 5.90% on average, slightly increasing from the 5.77% average in the prior quarter.
Meanwhile, retail sector cap rates averaged 6.70%, up from 6.45% in Q3, while Industrial cap rates averaged 6.40%, up from 6.24%. Smaller property types were mixed, with self-storage cap rates climbing from an average of 5.86% in Q3 to 6.20% in Q4, while hotels fell from an average of 7.80% to 7.30%.
With valuations trending in an overall positive direction, the uptick in cap rates reflects some upward movement in operating incomes across key sectors.
9. IMPACT OF FEDERAL WORKFORCE CUTS
Recent cuts to the federal workforce could significantly impact local commerce and commercial real estate in the Washington D.C. area, as explored in a recent analysis by Globe Street.
Increased layoffs in and around D.C. have largely not shown up yet in unemployment claims data. Roughly 9,500 full-time federal workers and 200,000 probationary workers were laid off on the day before the most recent reporting period began, but initial claims rose just 5,000 above the previous week’s level.
However, initial claims figures are seasonally adjusted and may understate the impact of the federal layoffs. Globe Street found that non-adjusted data actually showed a 4.8% week-over-week decrease in initial claims, but the decline was more tepid than the 6.6% projected by seasonal factors, suggesting layoffs are higher than typical for this time of year.
Some economists suggest the layoffs could have far-reaching effects, potentially dampening local consumer activity and housing demand while decreasing revenues from national firms that provide or rely on federal services.
10. INDEPENDENT LANDLORD RENTAL PERFORMANCE
According to the Chandan Economics-Rent Redi Independent Landlord Rental Performance Report, on-time payments to independently operated rental units declined in February, falling by 16 basis points from January to 85.2%.
Conversely, the forecasted full-time payment rate for February, which estimates the effect of late payments that will be received throughout the month, rose for the first time since October.
Western states continue to experience the highest on-time payment rates nationwide, led by Ohio, Utah, Colorado, New Mexico, and Alaska.
2-4 family rental properties and single-family rentals hold the highest on-time payment rates, each at 85.7%
The Federal Reserve held rates unchanged at 4.25-4.50% at its January meeting, on par with market expectations.
Solid labor market performance and somewhat elevated inflation kept officials neutral as they continued to assess the impact of the three consecutive rate cuts made at the end of 2024.
A slight adjustment in the Fed’s meeting statement this month deemphasized inflation’s “easing”, language that accompanied the December decision. Markets initially interpreted the Fed’s change in language as a hawkish signal, dampening equities and sending treasury yields higher. However, markets reverted following Chair Powell’s post-meeting briefing, in which he affirmed that the FOMC feels confident in the economy and its policy options’ flexibility.
Powell confirmed that Fed researchers are keeping an eye on proposed changes to trade, immigration, and regulatory policy due to their potential impact on inflation and employment. However, when pressed about the anticipated effects of these changes, Powell stated that officials would withhold that assessment until specific changes become clearer.
2. TREASURY MARKETS
The current yield on a 10-year US treasury bond is hovering near 5%. While rising long-term yields sometimes reflect an anticipation of higher growth and the higher rates needed to keep the economy from overheating, it may reflect concerns about America’s fiscal trajectory.
Yields climbed in reaction to the FOMC’s January interest rate decision, where the committee held rates unchanged and referenced both confidence and uncertainty about economic developments.
Recently, some fixed-income analysts have warned that rising bond yields signal a higher term premium demanded to fund US debt, reflecting concern about the inflation and fiscal risks from trade uncertainty.
Analysts say bond markets could play out in several ways. On the one hand, a deregulatory push could boost economic potential and dampen the term premium. Meanwhile, a cascading trade dispute or a tax cut extension without significant spending cuts could renew upward pressure on yields.
3. THE AI RACE AND DATA CENTER DEMAND
A shocking AI advancement by Chinese company DeepSeek upended the US tech market this week as investors reassess the dominance of US tech firms in the AI race. It also sparked debate about domestic data center demand.
Data centers have garnered increased attention in recent years as the AI race takes off due to the nascent technology’s high electricity demand. According to the investment bank Jefferies, projected AI needs represent 75% of the overall US electricity demand through 2035 in most forecasts.
However, DeepSeek raised the stakes for US AI firms after building a generative AI model with significantly less hardware and energy, challenging the energy-demand thesis driving data center development. US utility firms dependent on data center demand also saw their stock prices take a hit following the DeepSeek news.
Nonetheless, a more competitive AI space would likely create down-the-road opportunities for data centers. As AI infrastructure becomes cheaper to build and AI applications become easier to produce, it could funnel new capital into startups and widen the customer base for data center providers.
4. BUSINESS UNCERTAINTY
According to the Atlanta Federal Reserve’s January 2025 Survey of Business Uncertainty, sales revenue growth expectations have risen in recent months but remain more uncertain compared to pre-pandemic averages.
The survey, which polls about 1500 senior managers at US firms monthly, shows that year-ahead sales growth expectations are the highest since the end of 2022. Additionally, expected employment growth has improved recently, while uncertainty surrounding employment growth has returned to pre-pandemic levels.
Sales uncertainty has fallen but remains high by historical standards. As of January 2025, year-ahead sales growth uncertainty is at its lowest since 2020 but continues to hover close to around 4% compared to a pre-pandemic coalescing around 3%.
5. CONSUMER CONFIDENCE
US consumer confidence fell at the start of the year, according to the latest reading from the Conference Board.
While some deterioration was expected following a holiday season bump, the index, which measures American’s assessment of both current conditions and their six-month outlook, fell steeper than most economists expected.
The current conditions index tumbled 9.7 points in January, while the more narrowly scoped labor market conditions index fell for the first time since September.
American’s short-term expectations for income, business, and the job market also fell. However, anticipation of a recession over the next 12 months remained relatively low.
6. RETAIL SALES
US retail sales were up 0.4% month-over-month in December, according to the latest data from the Census Bureau.
The reading reflects some added momentum to consumer activity to close 2024 and prompted some economists to revise up their growth forecasts for 2025.
While the holiday season contributed to the uptick, sales rose 4.2% from December 2023. According to the retail trade report, strong demand for motor vehicles and non-store retailers helped drive the increase, with sales up 8.4% year-over-year and 6.0% year-over-year, respectively.
Strong retail data also likely contributes to the Fed’s caution around rate cuts as they monitor demand indicators to prevent an inflation resurgence.
7. LOGISTICS PROPERTY RENTS DROP
According to new data from Prologis, rent growth for US logistics properties turned negative in 2024, the first drop in 15 years.
Rents in the US and Canada fell by 7% on average, steeper than the 5% decline experienced globally. The decline was partly led by slower growth in markets with recently high competition rates, such as Phoenix.
US logistics rents are still up 59% compared to 2019, leaving most inventors well positioned, while lower rents could entice new tenants looking to scoop up cheap space in the high-demand sector..
8. INDEPENDENT LANDLORD RENTAL PERFORMANCE
According to the Chandan Economics-RentRedi Independent Landlord Rental Performance report, the on-time payment rate in independently operated rental units slipped by 70 basis points (bps) in January and is down 112 bps year-over-year, falling to 85.0%.
On-time collections had stabilized for the latter half of 2024, holding between 85.4% and 85.8% from July through December. January’s estimate signals some deterioration in tenant payments—as it currently stands, this month’s on-time collection rate is the lowest on record since April 2021.
Western states continue to hold the highest on-time payment rates in the country, led by Idaho, Utah, Nevada, North Dakota, and Colorado.
Meanwhile, 2-4-family and single-family rental properties held the highest on-time payment rates in January, reaching 85.2%.
9. BEIGE BOOK
According to the Federal Reserve’s latest Beige Book, economic activity increased “slightly” to “moderately” in most regions between late November and early December, driven by higher-than-expected consumer holiday spending.
Construction activity generally declined as producers reported high materials and financing costs that dampened business expansion. Residential real estate activity was on balance unchanged as elevated mortgage rates kept demand at bay. Commercial real estate sales ticked up.
Manufacturing declined slightly, with many manufacturers reportedly stockpiling inventories in anticipation of higher tariffs. Meanwhile, truck freight volumes fell.
10. NEW HOME SALES
Sales of newly built single-family homes jumped by 3.6% in December to a seasonally adjusted annualized rate of 698k, the highest increase since September and well above market expectations.
Sales growth was sustained despite a surge in mortgage rates during the month. The West region of the US led by volume, selling at an annualized rate of 154k units per year. The West was followed by the Northeast, with an annualized rate that would amount to a 41.7% increase. Sales rates in the South and Midwest fell.
The median price of a newly built single-family home was $427k, up from $402k in December.
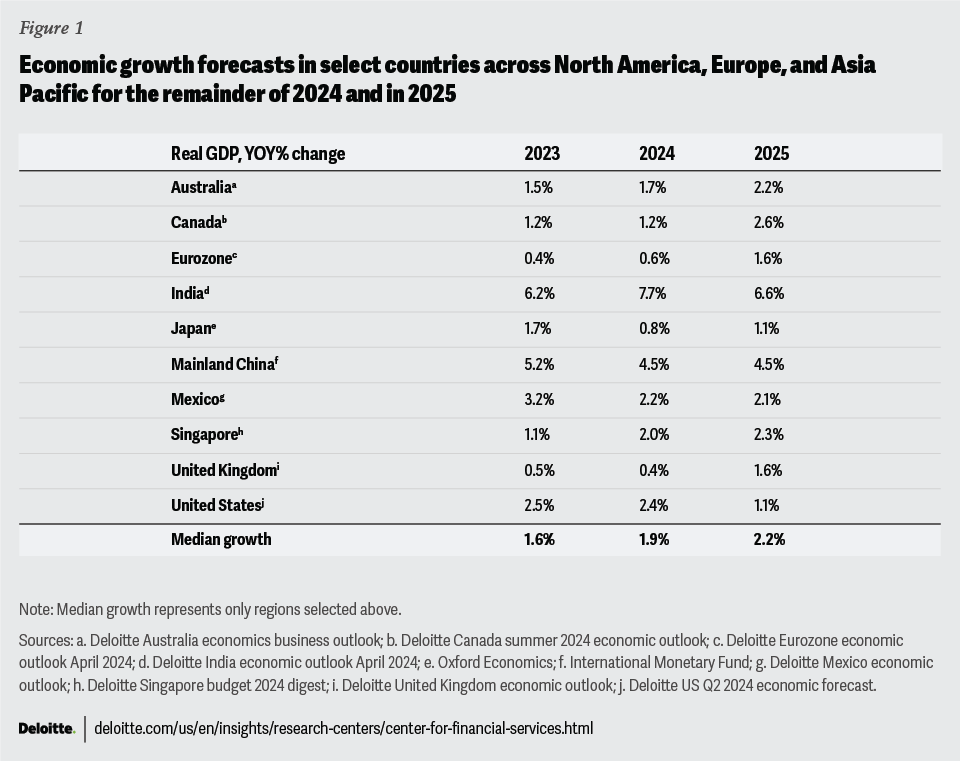
According to Deloitte’s 2025 look-ahead, the current outlook for Commercial Real Estate is dominated by expectations surrounding global interest rates, renewed revenue sentiment, and the potential for industry-wide shifts in areas such as AI, climate resilience, and regulation.
Rates are projected to fall across most major economies in 2025 — however, so is growth. Deloitte’s forecast projects that Real US GDP will fall from a projected 2.4% annual growth rate in 2024 to 1.1% in 2025. The Fed’s interest rate pivot has boosted CRE market sentiment. Still, uncertainty around the timing and volume of rate cuts will keep some capital deployment at bay until things become clearer.
Revenue growth is expected to recover, with 88% of global executives surveyed by Deloitte anticipating higher revenue next year compared to 2024. For context, 60% of executives forecasted declines coming into 2024. In the year ahead, roughly two in three respondents expect revenue to increase by more than 5%.
Data and technology, including AI development, are seen as key drivers of growth in the coming years. 81% of executives plan to increase their technology investments.
Climate resilience also continues to be an increasing focus of CRE leaders. 76% of survey respondents plan to invest in significant energy retrofits over the next 12-18 months.
2. CPI INFLATION
According to the Bureau of Labor Statistics, the Consumer Price Index (CPI) rose 0.2% month over month in October and 2.6% year-over-year, each roughly in line with expectations.
Core-CPI, which removes the more volatile food and energy components, accelerated 0.3% month-over-month, boosted by shelter costs, which accounted for half of the gain in overall CPI. Meanwhile, the energy component held flat while the food index climbed by 0.2% in the month.
Other notable increases included used vehicles, which rose 2.7% month-over-month, and airfares, which jumped 3.2% during the month.
Inflation-adjusted wages increased modestly, rising 0.1% month-over-month and 1.4% from one year ago.
With CPI arriving roughly in line with expectations, the reaction from the interest rate futures market was negligible. At their upcoming December policy meeting, the FOMC is projected to make one additional quarter-percentage-point cut before the end of the year.
3. COMMERCIAL PROPERTY PRICES
According to the MSCI-RCA Commercial Property Price Index, national commercial real estate prices fell just 0.1% month over month and -1.5% year-over-year through October. This performance represents a gradual recovery of commercial prices as the market reaches a cyclical inflection point.
Apartment prices fell by 0.3% from September and 6.1% year-over-year through the end of October. Retail property prices fell 0.1% from September and 1.9% year-over-year.
Industrial again emerged as the only major asset group to post a monthly or annual increase, rising 0.6% month-over-month and an impressive 7.6% over the past 12 months.
The Office sector as a whole fell by 0.1% month-over-month, but suburban office prices climbed by 0.1%. All office segments continue to post year-over-year declines — but suburban office prices have gradually improved this year, resulting in a positive three-month moving average for the broader office sector.
4. INTEREST RATES
According to the Chicago Mercantile Exchange’s Fed Watch Tool, there is a 55.5% chance that the FOMC will follow through with a 25-basis point cut at their December policy meeting, reflecting a relatively split futures market. The forecast has declined from just a week earlier when futures markets priced in an 82.5% probability of cut.
The split sentiment reflects monetary doves who, on the one hand, reference a recent labor market slowdown and shift in the Fed’s dual mandate focus to predict further accommodation. On the other hand, monetary hawks note strong economic growth and Fed officials’ relative caution over cutting too fast as evidence that rates may remain where they are as we turn to the new year.
At the FOMC’s November meeting, the committee voted to cut the Federal funds rate by 25 basis points, following up on their 50-basis point cut in September that began their pivot to accommodative monetary policy.
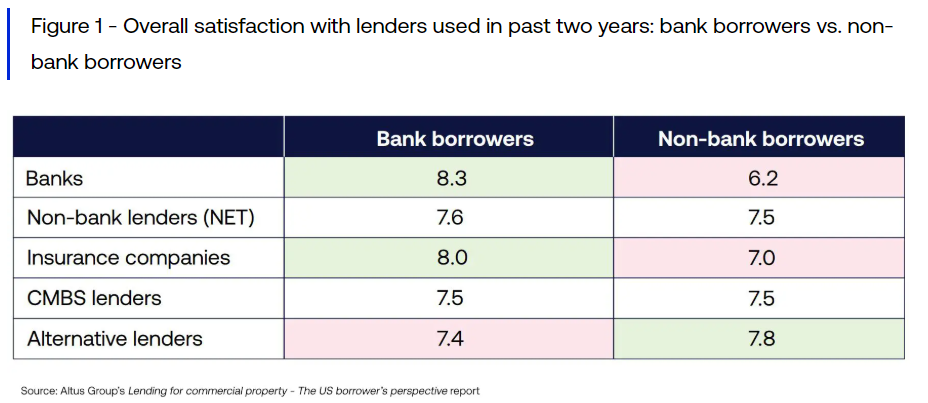
5. NON-BANK CRE BORROWING
A recent Altus group survey investigated the experiences that commercial real estate borrowers have had with non-bank lenders and polled their expectations, recommendations, and challenges.
Borrowers polled expressed a desire for greater efficiency and consistency from their lenders. Bank borrowers expressed higher overall satisfaction with their CRE lenders, while non-bank borrowers referenced flexibility and service as the top factors for their choice.
Non-bank borrowers reported fewer steps to secure financing than bank borrowers. However, their deals tended to move more slowly. Moreover, some expressed higher levels of concern about managing market risks and challenges they expect to face in the coming years.
6. NAHB HOUSING MARKET INDEX
The latest data from the National Association of Home Builders’ Housing Market Index shows that it reached its highest level in seven months during November, exceeding expectations.
The index received a post-election bump, as builders expressed confidence that the Republican sweep of Congress and the White House will increase the likelihood of significant regulatory relief and boost construction activity.
The current sales conditions indicator rose on the month, as did the gauge that measures sales expectations for the next six months. Prospective buyer traffic also posted a modest gain from October.
There was also a modest decline in the share of builders cutting prices and their amounts. 31% of homebuilders slashed prices in November, compared to 32% in October, while the average price reduction was 5%, slightly below the 6% rate posted in October.
7. INDEPENDENT LANDLORD RENTAL PERFORMANCE
According to the latest report from Chandan Economics, the on-time payment rate in independently operated rental units remained flat at 85.5% in November compared to the previous month.
On-time collections are down by 70 bps from a year earlier. Moreover, compared to the post-pandemic peak of 88.2% set in April 2023, on-time payments are down by 279 bps, reflecting some sustained performance deterioration.
Still, there are signs that on-time collections are stabilizing. For the past five months of data, on-time payment rates have held between a low of 85.3% and a high of 85.7%.
Trends within key rental subsectors reveal a slight performance gradient. Of the three tracked property sub-types, properties with 2-4 rental units and single-family rentals (SFR) led the way in November 2024, with the two subsectors holding an on-time payment rate of 85.7%, respectively. Multifamily properties sat slightly lower at 85.1%.
Measured by State, western-located properties continue to outperform the rest of the country. In November 2024, on-time payment rates stood highest in Alaska (93.7%), followed by Nevada (91.9%), Utah (91.4%), Colorado (91.4%), and New Mexico (91.1%).
8. ENGINEERING & CONSTRUCTION INDUSTRY OUTLOOK
According to Deloitte’s 2025 Engineering and Construction Industry Outlook, the improving interest rate outlook, technological integration, and navigating the policy landscape will guide the industry over the next year.
Falling rates are expected to boost construction demand across various segments and create growth opportunities in 2025. However, labor market challenges persist. The engineering and construction sector faces a significant talent shortage, posting an average of 382k job openings between August 2023 and July 2024.
Cost overruns from inflation and interest rates will incentivize firms to focus on value creation and sustaining growth through strategic divestitures and rebalancing capital allocation. Large construction firms may optimize portfolios by divesting noncore assets and doubling down on core investments.
Like other sectors, adopting AI and other digital tools to enhance productivity and address labor gaps will be crucial to the engineering and construction field. Technologies such as digital twins, robotics, and generative AI will continue to transform operations in the industry.
The policy outlook is also key. Recent federal investments through the Infrastructure Investment and Jobs Act (IIJA), the Inflation Reduction Act (IRA), and the CHIPS and Science Act will continue to trickle into markets in the coming year. The activity is expected to drive growth in the manufacturing and energy sectors and generate downstream demand for engineering and construction firms.
9. HOUSING INVENTORY REBOUND
According to a recent analysis by ResiClub, 54 of the nation’s 200 largest housing markets have inventory levels above their pre-pandemic levels, a significant jump from just 17 at the end of 2023.
From October 2019 to October 2021, the number of US actively listed homes fell from 1.2 million to just 566k, a 53% drop in just two years.
However, inventory is gradually recovering, reaching 954k through October 2024, still a large but more modest 21% below the 2019 benchmark.
Smaller markets have tended to be the ones to see the most recovery. Huntsville, AL, Killeen-Temple, TX, and Lubbock, TX, have experienced the strongest post-pandemic recoveries but rank 108, 119, and 162, respectively, in national metro size.
The Bridgefield-Stamford-Norwalk, CT metro remains the furthest below pre-pandemic levels, followed by Connecticut’s largest metro area, Hartford-East Hartford-Middletown. Peoria, IL, ranks the third furthest below 2019 levels.
10. NMHC QUARTERLY SURVEY OF APARTMENT CONDITIONS
According to the Q3 NMHC Survey of Apartment Conditions, Multifamily financing and sales volume reached their highest level since 2022 during the third quarter.
43% of respondents reported higher sales in Q3 2024 compared to 32% during the previous quarter. With the Fed’s first interest rate cut only coming in September, the early pace of thawing deal activity is an encouraging indicator for the sector.
The equity financing gauge rose from an index level of 49 in the previous quarter to 67 in the Q3 reading. In October 2023, the reading stood at just 18.Optimism increased around debt financing, with 62% of respondents seeing now as a better time to take out a Multifamily mortgage, compared to just 37% who expressed this sentiment in Q2.
Looking market to market, 38% of respondents listed “primary markets” like New York, San Francisco, Los Angeles, and Miami as benefiting from sales activity better than the secondary or tertiary markets that dominated initial post-pandemic activity. Still, roughly 45% saw no change.