1. COMMERCIAL PROPERTY PRICES
- According to the latest MSCI-RCA Commercial Property Price Index, U.S. commercial real estate prices fell 0.4% month over month in December but are up 0.2% over the past 12 months. After signs of strength towards the middle of 2025, price growth began to soften again in recent months, with the average price down 0.9% since September.
- Office price trends continue to diverge between its Suburban and Central Business District (CBD) segments. Suburban office prices rose 2.7% in 2025 and, through December, marked their largest annual increase since August 2022. Meanwhile, CBD office prices declined 2.9% in 2025.
- Industrial prices rose 2.0% in 2025, but fell modestly in December, down 0.3% from November. The sector has consistently maintained price resilience throughout 2025, contrasting with the broader CRE market over the same period.
- Transaction-level apartment prices fell by 1.4% over 2025, but the sector posted a 0.1% gain in December. Apartment prices had been showing renewed momentum in recent months after nearly 2 years of annual declines, but the latest reading suggests some softening is underway.
- Retail prices fell 0.5% from November, but values rose 0.2% in 2025.
2. NATIONAL INDUSTRIAL PERFORMANCE
- According to Commercial Café’s January 2026 Industrial report, in-place industrial rents averaged $8.87 per square foot nationally at the end of 2025, up 5.4% for the year.
- Transaction volume in the Industrial sector reached its strongest level since 2022, while average sale prices per square foot rose 10% year-over-year.
- Meanwhile, the national vacancy rate began the year at 9.2%, 120 basis points higher than one year ago.
- Industrial vacancies have more than doubled over the past three years, while last year’s deliveries hovered at just above 300 million square feet—the slowest year for construction since 2017.
- Nonetheless, the construction pullback is expected to benefit the industrial sector, with Commercial Café projecting vacancies to plateau in the first half of 2026 before falling in the second half.
- Elsewhere, the economic uncertainty caused by ongoing U.S. trade disputes and negotiations is likely to continue into this year, with a review of the U.S.-Mexico-Canada trade agreement (USMCA) due in July.
3. GDP FINAL ESTIMATE
- The U.S. economy expanded at a faster pace than initially estimated during Q3 of 2025, according to the Bureau of Economic Analysis’s final GDP estimate for the quarter.
- Real GDP rose at a 4.4% annualized rate in Q2 2025, slightly above the 4.3% estimate, but remained the strongest quarter for U.S. growth since Q3 2023. The upward revision mainly reflected stronger exports and a smaller drag from inventories.
- Exports surged by 9.6% in Q3 2025, revised up from an initial estimate of 8.8% and rebounding from a 1.8% decline in Q2. Imports, which are subtracted from the GDP calculation, fell 4.4%.
- The impressive Q3 growth was driven primarily by robust consumer spending, up 3.5%— its fastest pace in 2025. Government outlays also rose, up 2.2% compared to -0.1% in Q2.
4. PCE INFLATION
- Both headline and core PCE inflation, which is the Federal Reserve’s preferred source of price data for the purpose of setting monetary policy, rose 2.8% year-over-year through November 2025, according to data from the Bureau of Economic Analysis.
- The core PCE price index, notably, remains above the Fed’s annual 2.0% target, complicating upcoming monetary policy decisions as policymakers contend with a weak labor market amid above-target price pressures. Federal Funds Rate futures suggest a low likelihood of the FOMC easing rates in the near term.
- The headline PCE metric rose 0.5% month-over-month while core-PCE increased 0.2%. Increases in both goods and services prices contributed to the rise.
5. U.S. CONSTRUCTION SPENDING
- According to a delayed data release by the Census Bureau, U.S. construction spending rose 0.5% month-over-month in October, following a 0.6% decline in September. Year-over-year, construction spending is down by 1.0%.
- While the final two months of 2025 data are yet to be released, October’s data suggests that construction spending for the year was subdued relative to 2024. Through the first 10 months of 2025, construction spending totaled $1.825 trillion, 1.4% below the $1.851 trillion registered for the same period in 2024.
- Residential construction spending rebounded in October, rising 1.3% following a 1.4% drop in September. However, renovations are likely responsible for much of this increase, as both new single-family (-1.3%) and multifamily (-0.2%) projects declined.
- Nonetheless, residential investment was the primary driver of a 0.6% increase in private-sector spending in October.
- Non-residential construction spending contracted by 0.2% in October, while public spending ticked up by 0.1%.
6. DATA CENTER BUCKS CONSTRUCTION TRENDS
- According to analysis by the Wall Street Journal (WSJ), while broader commercial real estate construction trends point to lower growth in 2026, the Data Center sector stands out as a key exception.
- The WSJ estimates that Data Center construction spending will rise by 23% in 2026 as tech firms continue to build out their AI infrastructure.
- The forecast also expects the sector to be less sensitive to financing costs relative to other major segments, which could prove essential as the path of interest rates in 2026 remains highly uncertain.
- The report also notes that data center demand could crowd out other non-residential construction projects as real estate developers contend with labor and cost pressures. The capital pouring into data center projects could enable them soak up qualified labor more quickly, delaying pipelines in other non-residential sectors.
7. NATIONAL RENT COLLECTIONS
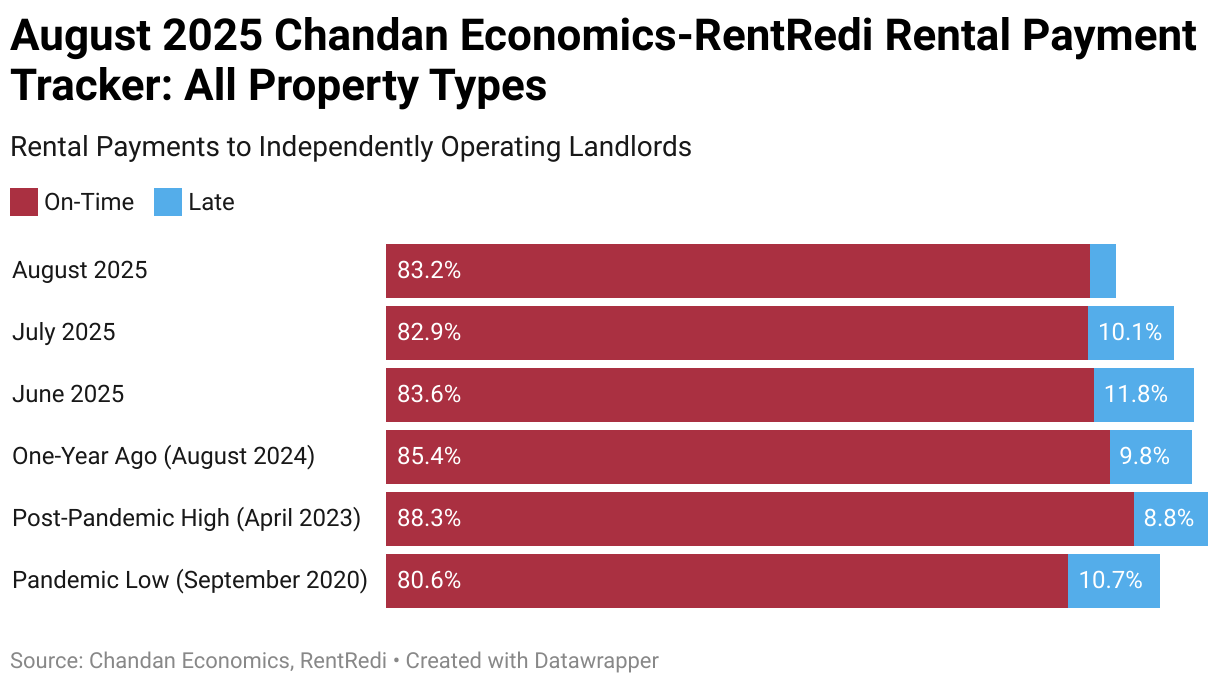
- According to Chandan Economics-Rent Redi national rent collections data, 83.3% of independently operated rental homes paid rent on time and in full in January, 20 basis points (bps) above December’s revised estimate of 83.5%.
- Measured year-over-year, on-time payment rates remain materially lower than a year ago, marking the 30th consecutive month of annual declines. However, month-over-month trends in on-time rates began to stabilize in mid-2025.
- Late payments have been the primary driver of underperformance, remaining above 10% throughout 2025. The three-month moving average of late payments to independent landlords climbed from a low of 8.4% in May 2024 to a post-pandemic high of 13.4% in September 2025.
- However, the late payment share in November 2025, the latest month for which a full estimate is available, fell to 12.8%. Chandan Economics’ projects further improvement in the months ahead, with the forecast late-payment rates for December and January sitting at 12.5% and 11.2%, respectively.
- Despite the relatively soft on-time performance, full-payment rates have remained resilient, with 2025 averaging approximately 96.0%, outperforming the 2024 average.
8. CONSUMER CONFIDENCE
- According to the Conference Board’s latest Consumer Confidence Report, sentiment fell sharply in January, from an index reading of 94.2 in December to 84.5 in the latest print.
- Both the present situation and expectations index collapsed in January. The former, which measures consumers’ assessment of the current business and labor climate, fell 9.9 points to 113.7.
- The expectations index, which gauges consumers’ near-term outlook, fell 9.5 points to 65.1. A reading below 80 is historically consistent with an upcoming recession.
- One of the top concerns for consumers remains inflation, with affordability constraints for the costs of food, groceries, and gas frequently cited in responses.
- Elsewhere, the gap between those saying jobs are “plentiful” and “hard to get” fell from 8.4 to 3.1, the highest “hard to get” reading since 2021.
- Notably, declines in consumer confidence are observed across all age and income groups, with the sharpest drops among households earning less than $15,000 and those earning over $50,000.
- An important caveat to the worsening sentiment is that spending by upper-income households continues to outpace what sentiment trends would suggest. February’s consumption activity will reveal whether the sharp drop in sentiment has translated into meaningful changes in consumption.
9. HOMEBUILDER SENTIMENT
- Homebuilder sentiment fell in January and registered its 21st consecutive month below the 50-point contraction/expansion threshold, according to the latest measure of the NAHB/Wells Fargo Housing Market Index (HMI)
- All three sub-indices of the HMI contracted in January, with the current sales conditions index declining by one point to 41, while the index measuring sales expectations over the next six months fell by three points to 49.
- The index measuring the traffic of prospective buyers contracted three points to 23.
- 40% of builders reported cutting sales prices in January, unchanged from December. However, it is the first time since May 2020 that the share of builders cutting prices sat at 40% or lower for three consecutive months.
- The average price reduction in January was 6%, up from 5% in December.
10. PENDING HOME SALES
- •According to the latest data from the National Association of Realtors (NAR), U.S. pending home sales fell sharply in December, with the index down 9.3% to a five-month low of 71.8.
- The decline was attributed to a lack of available homes for sale, with inventory reaching its lowest level of 2025 in December. Pending home sales are down 3.0% year-over-year.
- All regions of the country experienced month-over-month declines, with the sharpest occurring in the Midwest, falling 14.9% from November. The West region experienced the second-worst month-over-month decline, down 13.3%. The index for the Northeast and South regions fell by 11.0% and 4.0%, respectively.
- Consumers report preferring to see more inventory before committing to a purchase. The sudden decline occurred despite declining mortgage rates and has dampened the short-term outlook for the housing sector.
SUMMARY OF SOURCES
1. 3RD QUARTER GDP
- Real GDP expanded by a seasonally adjusted annualized rate of 4.3% during the third quarter of 2025, according to the latest estimate from the Bureau of Economic Analysis.
- Growth was well above the 3.3% consensus estimate, propelled by expanded consumer and government spending. Consumer spending grew at a 3.5% annual pace, contributing about 55% of total output for the quarter. Outlays on healthcare, recreation, and non-durable goods drove the increase in consumer spending.
- A shift in trade dynamics was also a key contributor to the faster-than-expected growth in Q3. Exports jumped by an annualized 8.8% rate while imports, which are subtracted from the GDP calculation, declined by 4.7%.
- Government outlays also outpaced estimates, rising at an annualized rate of 2.2%, driven primarily by a 5.8% increase in national defense spending.
- Meanwhile, business investment grew more tepidly, decelerating to 2.8% in Q3 and contributing a drag on overall economic output. AI investment and cap-ex spending on information processing equipment were robust during the period, but high borrowing costs and labor headwinds tempered spending on structures and residential investment.
2. NOVEMBER JOBS REPORT
- According to the latest data from the BLS, nonfarm payrolls were little changed in November, with employers adding just 64,000 jobs. It follows an October decline of 101,000 payrolls.
- The headline unemployment rate rose from 4.4% in September to 4.6% in November. Meanwhile, average hourly earnings rose to $36.86, up 3.5% from November 2024.
- The most notable job increases were in health care (+46,000) and construction (+28,000), while declines were seen in federal government positions (-6,000) and transportation and warehousing (-18,000).
- US employment levels have barely changed since April, while a deeper analysis of the data shows that the number of people employed part-time for economic reasons has increased by 119,000 since September.
3. CPI INFLATION
- According to the Bureau of Labor Statistics, the US Consumer Price Index (CPI) decelerated to 2.7% year-over-year in November from 3.0% in September.
- Due to the recent government shutdown, October data was not calculated. As a result, no month-over-month inflation measurements were made for November.
- Core-CPI, which excludes food and energy components, rose 2.6% year-over-year, its slowest pace since March 2021.
- The shelter index of CPI, which has been a key contributor to the post-pandemic inflation rise, cooled to 3.0% year-over-year in December.
- Food prices also decelerated from 3.1% in September to 2.6% in the latest reading. The “food at home” component rose 1.9% annually while the “food away from home” segment rose 3.7%.
- Meanwhile, energy prices rose sharply from September, climbing from 2.5% year-over-year to 4.2% year-over-year in December.
4. COMMERCIAL PROPERTY PRICES
- According to the latest MSCI-RCA Commercial Property Price Index, US commercial real estate prices were flat month-over-month but are up 1.6% over the previous twelve months through November.
- Overall deal volume during November was down compared to the same month one year ago, however, year-to-date volume has already exceeded 2024’s total.
- Industrial properties have experienced the strongest pace of price growth over both the past month and the previous year, climbing 0.5% from October and 5.1% over the past twelve months.
- Suburban office properties continue their 2025 recovery, rising 0.3% from October and up 2.7% year-over-year. CBD office prices continue to lag the suburban segment, with transaction prices down 0.7% from October and down 1.9% over the past twelve months.
- Retail prices are down 0.1% from October but remain 2.4% above the November 2024 level.
- Apartment properties continue to experience price corrections, falling 0.2% from October and down 1.4% year-over-year.
5. RETAIL RESILIENCY
- Despite retail sales being flat month over month between September and October of 2025, a deeper analysis of trends suggests the retail market is chugging along with strong momentum, with important implications for property values in the sector.
- Year-over-year sales rose 3.8% in October, while core retail sales, which exclude automobile, gasoline, and food services, are up 4.5%.
- Other signs of underlying strength in the sector include rising household net worth, wages that have outpaced inflation over the past 30 months, and relatively low unemployment.
- As a result of these strong fundamentals, a TD Cowen study suggests holiday sales growth could be up to 5% higher this year than in 2024.
6. NATIONAL INDUSTRIAL PERFORMANCE
- According to the latest CommercialEdge National Industrial Report, the average rent on Industrial properties rose by just 1 cent from October but is up 5.7% year-over-year to $8.76 per square foot as of November 2025.
- The national vacancy rate stands at 9.75%, rising 220 basis points over the past twelve months as new supply has outpaced demand throughout 2025.
- Sales volume has reached $68.4 billion year-to-date, and 2025 is poised to be the strongest year for transactions (in dollar-value terms) since 2022.
- As of the end of November, there were 382.7 million square feet of industrial space under construction across the United States. Year-to-date completions total 265.7 million square feet.
- Regionally, the Midwest remains the most affordable region for sector investment, led by Cleveland, which has the lowest nationwide rate among major markets at $56 per square foot.
- Dallas-Fort Worth leads the way in year-to-date sales volume at roughly $5.6 billion. Meanwhile, markets in Southern California, such as Los Angeles and the Inland Empire, experienced stagnating or declining prices in 2025.
7. OFFICE MARKET STABILIZATION
- The US Office market has shown signs of stabilization in 2025, as construction activity slowed to historic lows, allowing for some modest price gains and expanding utilization rates.
- Just over 12 million square feet of office development has been started through November, roughly on par with last year. Planned developments or those in process amount to 1.7% of total stock, down from 3.0% in 2024.
- The restrained development pipeline has coincided with a modest reduction in office vacancy, which has fallen to 18.5% through November. Among the top 25 markets, 16 saw vacancy rates decline in 2025.
- Physical occupancy remains flat, but some major markets, like Manhattan, have seen occupancy recover even as their supply pipeline grows.
- Further, for the first time since 2022, the average national asking price per square foot rose, signaling a critical inflection point for the sector.
- Growth in coworking remains an essential driver of sector expansion. According to Yardi Matrix, 22 million square feet of coworking space opened in 2025, a 16% increase over last year.
8. NATIONAL RENT COLLECTIONS
- On-time rental payments in independently operated apartment units rose by 73 basis points (bps) in December to 83.7%, according to the latest national rent collections data from Chandan Economics-Rent Redi.
- While on-time rent collections remain well below post-pandemic highs, they have been trending positively since August. However, measured on a year-over-year basis, on-time rates have declined for 29 consecutive months.
- Late payments have been the primary driver of underperformance in the mom-and-pop rental sector this year, with the rate remaining above 10% throughout 2025.
- Despite weaker on-time performance, full-payment rates have remained resilient in 2025, averaging 96.0% for the year — outperforming the 2024 average.
- Western states continue to post the strongest on-time payment rates nationally, led by South Dakota, Utah, and Alaska, while New Hampshire remains a top-performing East Coast standout.
- 2–4-family rental properties once again led all property types in December, posting the highest on-time payment rate at 84.2%.
9. HOMEBUILDER SENTIMENT
- Homebuilder sentiment ticked up slightly in December but remained in contraction, according to the latest measure of the NAHB/Wells Fargo Housing Market Index.
- The index, where a reading below 50 indicates that more builders view conditions as poor than good, rose from 38 to 39 during the month.
- The current sales conditions portion of the index increased by 1 point to 42, while the index of future sales expectations rose by 1 point to 52.
- Notably, future expectations have registered above the breakeven threshold (50) for three consecutive months. However, prospective buyer traffic was unchanged at 26.
- The share of builders offering sales incentives reached 67% in December, its highest level during the post-pandemic period. 40% of builders lowered prices at sale, with the average reduction being 5%.
- Cost headwinds, including high material and labor prices, alongside regulatory and economic headwinds, continue to afflict homebuilder activity.
10. EXISTING HOME SALES
- According to the National Association of Realtors (NAR), existing home sales rose in November for the third consecutive month, rising 0.5% in October to a seasonally adjusted annual rate of 4.13 million. It’s the highest sales pace in nine months.
- The median sale price rose 1.2% year-over-year to $409,200 in November, marking the 29th consecutive month of annual price gains.
- Meanwhile, housing inventory fell 5.9% from October to 1.43 million units. The total months’ supply of existing inventory is down from 4.4 months in October to 4.2 months in the latest reading.
- The average number of days that homes stayed on the market rose from 34 days in October to 36 in November.
- According to the report, sales were bolstered during the month by lower mortgage rates, but first-time buyers accounted for a smaller share of sales—down to 30% in November from 32% the previous month.
2025
SUMMARY OF SOURCES
1. ANNUAL CRE PRICE GROWTH CLIMBS
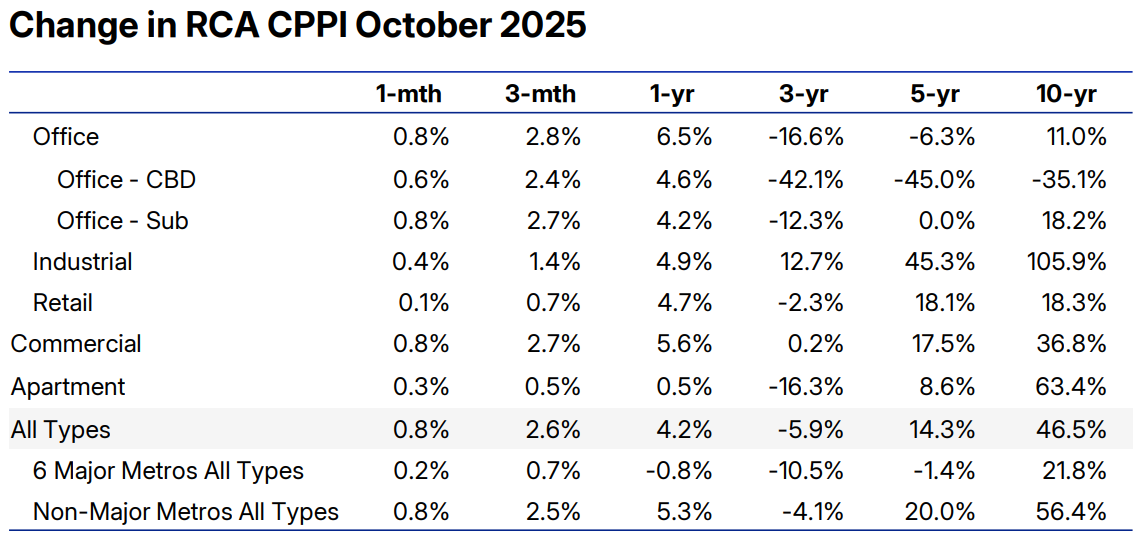
- According to the MSCI-RCA Commercial Property Price Index, which measures repeat-sales transaction pricing, CRE prices are up 4.2% year-over-year through October, its largest annual increase in three years.
- Commercial property prices rose 0.8% on the month, bringing the annualized rate to 10.7%. Notably, however, deal volume fell 22% in October.
- Industrial prices increased 4.9% year-over-year and 0.4% from September. Despite a slowdown in Annual price growth for Industrial assets, they have posted monthly price gains in each month since May 2023.
- CBD and Suburban Office prices rose 4.6% and 4.2%, respectively, compared to one year prior.
- Retail property prices rose 4.7% year-over-year and 0.1% from September. Retail prices have increased on a monthly basis for 17 consecutive months.
- Apartment prices were up 0.5% year-over-year in October, the third consecutive month of annual gains for Apartment assets following nearly three years of year-over-year declines. Apartment prices growth accelerated to 0.3% during the month.
2. HOLIDAY SPENDING PROJECTIONS

- According to Visa’s annual holiday season forecast, US shoppers are poised to spend more this holiday season compared to 2024, despite elevated economic headwinds and uncertainty. Still, inflation is expected to be a large contributor to sales growth this year compared to last.
- Visa projects that holiday season retail sales (sales between November 1st and December 31st, excluding auto dealers, gas stations, and restaurants) will rise 4.6% from last year.
- However, after inflation adjustments, Visa forecasts that real spending will rise just 2.2% year over year, down from last year’s 2.5% increase.
- Inflation for holiday-related items is below the overall CPI but catching up. Recreational goods, which make up about 30% of the holiday sales CPI basket, have experienced a 3.1% annual price increase through September.
- Consumers report they plan to spend an average of $736 on holiday gifts this year, which would be 10% above 2024’s actual spending.
- Survey data shows that baby boomer spenders plan to increase holiday spending by 21% over last year’s total, while millennial and Gen X consumers expect to spend between 5 to 7% more.
3. INFLATION AT THE THANKSGIVING TABLE
- According to Chandan Economics’ analysis of inflation at the Thanksgiving table, the price of eggs continues to mark the most significant increase in holiday input costs since 2020, though they are down year-over-year through September.
- Eggs are 74% more expensive than in 2020, more than 40 percentage points above the next highest Thanksgiving-related food item.
- Proceed items are the next highest on the list, driven mainly by intermediate costs such as labor, packaging, and transportation. Cakes and cookies are 31% from 2020, while gravy is up 29%.
- Turkey inflation has cooled, settling around 21% above 2020 prices, which closely follows the broader food-at-home trend.
4. CONSUMER CONFIDENCE FALLS
- Consumer Confidence fell in November to its lowest level since April, according to the Conference Board’s latest index reading.
- Confidence levels fell more than expected, driven by inflation concerns, while tariffs and politics also weighed on sentiment. The federal government shutdown received numerous mentions in survey responses.
- Mentions of the labor market eased compared to October but remain a key theme holding down consumer sentiment.
- Declines were noted across most income levels, except among those earning less than $15,000, who reported improved confidence in conditions, though they remain the least optimistic income group overall. Confidence declines were also present across political groups.
- Sentiment diverges by age group. Consumer confidence improved among those under 35 years old, but fell across all groups above that threshold. Consumers ages 55 and older are the least optimistic overall.
5. BUILDER CONFIDENCE/DISCOUNTS RISE
- According to the latest NAHB/Wells Fargo Housing Market Index, US homebuilder sentiment edged up to 38 in November, its highest in seven months. An index reading below 50 indicates that more builders view sales conditions as poor than good.
- Current sales conditions rose two points to an index level of 41, while prospective buyer traffic rose slightly to 26 during the month. The tepid uptick suggests that the impact of mortgage rate cuts during September has begun to taper off.
- Sales expectations for the next six months fell three points to 51, but the above-50 reading indicates that more builders expect higher sales in the coming months than those who don’t.
- Adding to signs of housing market weakness, 41% of builders reported cutting prices in November, the highest share of builders in the post-COVID period. The average discount in November was 6%, the same as in October.
6. SEPTEMBER RETAIL SALES
- US Retail Trade growth slowed in September to 4.3% annually compared to 5.0% in August, according to a delayed release of the September Retail Sales Report by the BLS. Sales were up 0.2% month-over-month.
- On a monthly basis, sales rose the most at miscellaneous store retailers (+2.9%), followed by gas stations (+2.0%). Sales at health and personal care stores also grew (+1.1%), as did food services and drinking places (0.7%) and furniture stores (0.6%).
- Sales during the month fell the most in sporting goods, hobby, musical instrument, and bookstores (-2.5%). Sales were also down at clothing stores (-0.7%), non-store retailers (-0.7%), electronic & appliance stores (-0.5%), and motor vehicles and parts retailers (-0.3%).
- GDP-related retail inputs were down 0.1% in September compared to a 0.6% gain in August.
7. SEPTEMBER PRODUCER PRICE INDEX
- According to a delayed release of the September Producer Price Index (PPI) report by the Bureau of Labor Statistics, US producer prices rose 0.3% month-over-month in September, reversing an August decline but still below some of the higher monthly marks this year. The annual PPI was unchanged from August at 2.7%
- Food production costs rose sharply, up 1.1% month-over-month compared to a 0.1% monthly increase in August. The PPI energy rebounded to 3.5% on the month from August’s -0.4%, driving goods inflation to its highest monthly increase in over a year (+0.9%). Prices for services fell 0.3% on the month, matching the previous month’s price decline.
- Producer price inflation was roughly in line with market expectations. Absent signals of resurging inflation pressures in October, the steady reading gives policymakers some breathing room as they weigh whether to cut rates again at their December meeting.
- Fed Funds futures imply that the Fed will cut rates by 25 basis points in December.
8. FOMC MEETING MINUTES
- Minutes from the Federal Reserve’s late-October meeting reveal that there remained an overwhelming consensus among committee members to cut rates, while one member voted for a larger, 50-basis-point cut.
- Participants cited slowing job growth and rising unemployment in their decision, while noting that the government shutdown limited data availability, creating a fog of uncertainty and forcing officials to temporarily rely on private-sector data. Economic activity continued to expand at a moderate pace.
- Members continued to express concern about recent tariffs and their potential to cause an uptick in core goods inflation over the coming quarters.
- Crucially, participants held increasingly divergent views on the potential for a December rate cut, with some suggesting a pause to await additional data.
9. AUGUST CONSTRUCTION SPENDING
- According to a delayed release of the August update of the Census Bureau’s monthly construction report, construction spending rose by a seasonally adjusted 0.2% from July but was down 1.6% year-over-year. Meanwhile, input costs are up 2.2% (non-adjusted) over the same period.
- Private construction spending rose by a seasonally adjusted 0.3% from July, while private residential spending was up 0.8% on the month. Non-residential construction rose by a seasonally adjusted rate of 0.3% month-over-month.
- In the public sector, the estimated seasonally adjusted annual rate of public construction was virtually unchanged from July ($517.5 billion).
10. SEPTEMBER JOBS REPORT
- According to a delayed release of the Bureau of Labor Statistics’ September payrolls data, US employers added 119,000 jobs in September, more than double the consensus Wall Street estimate and recovering from the 4,000 jobs decline in August. The unemployment rate edged up to 4.4%, its highest level since October 2021.
- The report ended a 44-day data vacuum, during which the lack of new labor and inflation data heightened market uncertainty.
- Following the report’s release, the probability of a Fed rate cut in December declined; however, the data’s outdated nature calls into question its usefulness for predicting the Fed’s December decision.
- In recent days, several major US companies have announced layoffs. At the same time, ADP data shows that the four-week moving average for private-sector job creation turned negative toward the end of October.
- Officials will likely rely on additional private employment data expected in the coming weeks, alongside reports such as the Fed’s Beige Book survey and the September Producer Price Index, to inform their December votes.
SUMMARY OF SOURCES
1. CPI INFLATION
- According to a delayed release of the Bureau of Labor Statistics’ September Consumer Price Index Report, prices rose 0.3% month-over-month, a softer pace than most analysts had expected.
- However, consumer prices rose 3.0% year over year, a slight uptick from August.
- Core-CPI inflation increased 0.2% from August, below market expectations of 0.3%. Annual core prices also eased by 10 basis points to 3.0%.
- Meanwhile, Shelter costs rose just 0.2% over the month, its smallest monthly increase in January 2021.
- Food prices moderated slightly, declining from a 3.2% annual increase in August to 3.1% in September. Energy prices were relatively stable at 2.8% despite a sharp uptick in gasoline prices during the month.
- Tariffs were linked to price increases in some core goods, such as appliances and apparel, but the impact remains relatively moderate.
2. FED INTEREST RATE DECISION

- The FOMC slashed its benchmark Federal Funds Rate by 25 basis points (bps) at its October 29th meeting, its second consecutive cut as the committee responds to a cooling labor market and downside risks to employment. The cut was largely expected.
- The decision was not unanimous, with a few members believing the committee should pause until more data comes in.
- Fed Chair Jerome Powell cautioned that a December rate cut is not a foregone conclusion, given that policymakers are operating in a “data fog” due to the government shutdown, which has created uncertainty about the appropriate path of policy.
- Inflation remains “somewhat elevated”, but tariffs have not filtered into prices as quickly as some expected.
- Most policymakers expect tariffs to have a one-time price increase and not lead to spiraling inflation, but some worry that they could still unanchor inflation expectations, which could in turn lead to self-fulfilling effects.
- On the labor market side, Jerome Powell reiterated his view that, because labor supply has shrunk (lower immigration and lower labor force participation), the Fed’s rate cuts will have only a limited impact on payroll growth. Still, he believes that some loosening will help keep labor demand from deteriorating further, justifying, in his view, the Fed’s recent cuts.
3. COMMERCIAL PROPERTY PRICES
- Commercial property prices rose by 0.7% month-over-month and 2.6% year-over-year in September, according to the latest data from MSCI-RCA.
- Investor sentiment broke more optimistic on average during Q3 as investment activity grew at a double-digit pace relative to one year ago. Deal activity has increased for six consecutive quarters.
- The Office sector led both monthly and annual increases, rising 1.4% and 7.1%, respectively. CBD Office prices grew 5.1% year-over-year compared to 4.5% for Suburban Office. Q3 2025 marked the first time since early 2022 that annual CBD price growth outpaced suburban office price growth.
- Apartment prices declined 0.3% from August and 0.8% year over year. The latest time apartment prices rose was at the end of 2022, and they are now 20% below their July 2022 peak.
- Retail prices grew 0.4% on the month and 5.5% year-over-year. Retail property prices have now increased for 17 consecutive months.
- Industrial property prices also rose 0.4% month-over-month, while rising 4.0% year-over-year. The Industrial index is 14% above its March 2022 level.
4. CRE TRANSACTIONS RISE
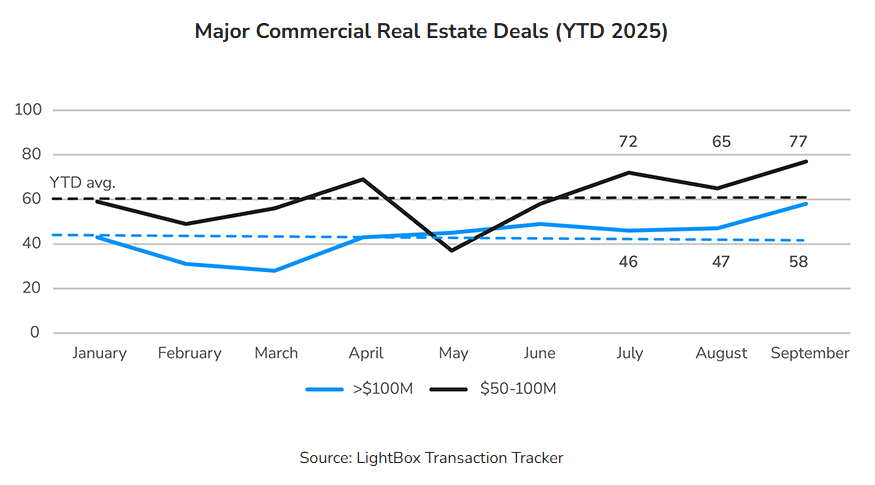
- According to LightBox’s CRE Transaction Tracker, the commercial real estate market posted its strongest month in 2025 during September, reaching $27 billion in transaction volume.
- Transaction volume increases were across asset types and geographies, but Multifamily, Retail, and Office Assets accounted for 64% of all closings. Industrial accounted for 17% of September deals, benefiting from stable demand in logistics-heavy markets.
- Mid-cap and nine-figure portfolio deals surged. Nine-figure deals were up 23% from August, while mid-cap transactions ($50-$100M) rose 18%, its highest monthly increase of 2025.
- 70% of assets tracked sold above their prior purchase prices, but sharp markdowns persist for older or underperforming offices.
5. GOVERNMENT SHUTDOWN SLOWS CRE PROJECTS
- According to CREA United, the National Association of Realtors, and other outlets, the government shutdown is having marginal but notable effects on real estate, including delayed government approvals, cancelled contracts, limited data availability, and market volatility.
- Previous shutdowns suggest that the most immediate impact on CRE is the delay of projects tied to federally backed financing. However, the current month-long shutdown has covered a time period that would typically include closings and loan-related verifications, likely causing delays.
- The last time a shutdown covered the end of a calendar month (December 2018), real estate businesses felt the impact in the form of tax transcripts that couldn’t be pulled, unfilled flood certifications, and delayed closings.
6. ATLANTA FED GDP NOW
- According to the Atlanta Fed’s latest GDPNow forecast, Q3 2025 real GDP growth is estimated at 3.9%, which would be significantly higher than the consensus forecast.
- The nowcast projects that real consumer spending rose 3.3% in Q3, while private investment grew by 4.4%. The nowcast for real government spending is 1.5%, while net export growth is estimated at 0.57%. Residential investment growth fell by 4.4%, which is slightly more positive than in Q2.
- With the government shutdown preventing the release of the Q3 2025 GDP data, which was expected on October 30th, the GDPNow tracker provides a proxy for observing growth trends.
- Importantly, as a nowcast, GDPNow is a running, real-time estimate of economic growth based on incoming data. Other forecasts, such as the Blue-Chip Consensus, show a much lower estimate of Q3 2025 of around 2.5%.
7. NATIONAL RENT COLLECTIONS
- According to the Chandan Economics-RentRedi October 2025 Independent Landlord Rental Performance Report, on-time payments in independently operated rental units rose by 99 basis points (bps) to 83.5% in October.
- Rent collections continue to improve from an August 2025 low of 82.4%. After drops of roughly 300 bps in July and August, the gap narrowed in September and October, suggesting a slow but steady recovery may be underway.
- Although on-time payment rates have improved month over month, they remain significantly lower than a year ago — down 223 bps. On-time collections have now declined year over year for 27 consecutive months.
- Late payments — the primary driver of underperformance in the mom-and-pop sector — have remained above 10% for most of 2025.
8. HOUSEHOLD MOVES HIT POST-PANDEMIC HIGH
- According to a Chandan Economics analysis of recently released US Census Bureau data, household moves hit a post-pandemic high in 2024, totaling approximately 12.3 million.
- The volume of relocations was 12.1% above 2023’s total, making it the most significant annual increase in the 21st century. Further, it is the first time that the number of moves has increased in consecutive years since 2010.
- Housing-related reasons — including (a) wanting new or better housing, (b) wanting a better neighborhood, (c) wanting cheaper housing, (d) transitioning to homeownership, or (e) some other non-distress reasons — accounted for 4.68 million moves over the past year.
- The most significant absolute increase is attributed to family/household formation reasons — including (a) establishing one’s own household, (b) a change in marital status, (c) moving in with an unmarried partner, or (d) another family reason.
- Retirement-motivated moves saw a large relative increase — up 57.8% year over year. Large swings in retirement-motivated moves have been common since about 2018.
9. EXISTING HOME SALES
- According to the National Association of Realtors, US existing home sales rose 1.5% month-over-month to an annualized rate of 4.06 million in September, its highest level in seven months and up from 4.0 million in August.
- The uptick was driven by lower mortgage rates and improving housing affordability.
- Single-family homes rose 1.7% from August to a seasonally adjusted annual rate of 3.69 million. Sales of condominiums and co-ops were unchanged at 370,000 total units.
- Regionally, sales increased month over month in the Northeast (2.1%), South (1.6%), and West (5.5%), but fell in the Midwest (-2.1%).
- Total housing inventory rose 1.3% to 1.55 million, representing 4.6 months’ supply of unsold inventory.
10. CONSUMER CONFIDENCE
- The Conference Board’s Consumer Confidence Index (CCI) declined slightly in October but fell to a six-month low, primarily driven by growing anxiety about job availability and business conditions.
- Still, consumer perception of current conditions improved, with the Present Situation Index rising in the month. However, expectations for the next six months worsened significantly and have remained under the recession threshold (index level of 80) since February 2025.
- Inflation remains consumers’ top concern, even as the number of survey mentions of tariffs declined. Meanwhile, consumers are increasingly more pessimistic about the job market.
- Results suggest a hit to holiday spending this year, as consumers anticipate spending less on both gifts and non-gift items.
SUMMARY OF SOURCES
1. FED INTEREST RATE DECISION
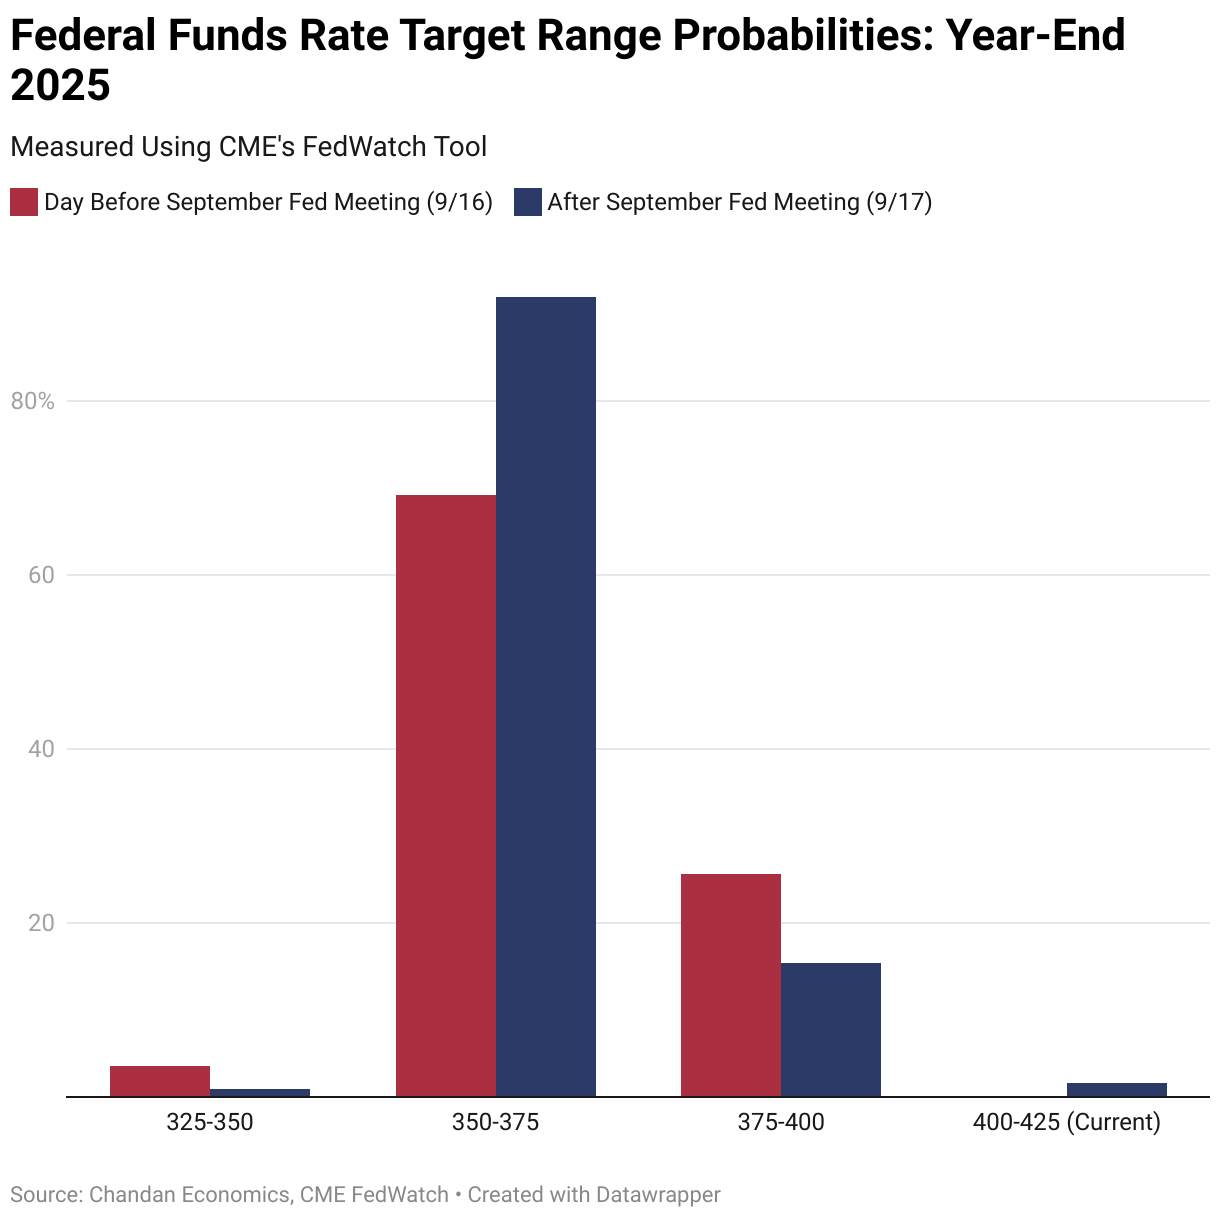
- The Federal Reserve cut the benchmark Federal Funds rate by 25 basis points at its September meeting, with just one official dissenting in favor of a larger, 50-basis-point cut.
- The Fed’s latest Summary of Economic Projections — released alongside the rate decision — lowers its forecast for next year’s interest rates while raising its inflation forecast.
- Compared to projections made in June, the median forecast for the Federal Funds rate was lowered by 30 basis points for 2025 and 20 basis points for 2026. Meanwhile, the 2026 PCE inflation projection was raised from 2.4% to 2.6%, while keeping the final 2025 projection at 3.0%.
- At the same time, the 2025 growth forecast was revised up from 1.4% in June to 1.6%, and officials upgraded the 2026 forecast from an expected 1.6% to 1.8%.
- The increasingly dovish outlook for rate cuts is a welcome sign for developers and builders; however, there is an increasing dispersion in the 2026 interest-rate projections made by FOMC members. On balance, the committee is signaling that it expects to move forward with cuts despite lingering price pressures.
2. OFFICE LEASING TRENDS SHOW STRENGTH
- According to Commercial Café, the national office vacancy rate improved to 18.7% in August, down 80 basis points year-over-year as Class A and amenity-rich properties continue to drive lease demand in top urban cores.
- Of the nation’s top 25 office markets, Houston had the steepest decline in office vacancy over the past year, falling 410 basis points to 20.2%.
- Meanwhile, the flight-to-quality trend has led to Manhattan registering its highest office utilization in five years in August. The vacancy rate in NYC’s core has decreased by 300 basis points over the past 12 months to 13.6%.
- On the other end is San Diego, which saw its vacancy rate climb by 350 basis points to 22.6% over the past year. Washington, D.C., reeling from declining space demand driven by federal workforce reductions, experienced a 260-basis-point increase in vacancy year-over-year.
- Nationwide construction activity remains sluggish, with only 10.7 million square feet of new office projects started and 17.3 million square feet delivered since the beginning of the year.
3. REAL ESTATE ROUNDTABLE SENTIMENT INDEX
- The Q3 2025 Real Estate Roundtable Sentiment Index rose 13 points from Q2 to an index level of 76, signaling a stronger outlook for operating conditions, asset values, and access to capital.
- Roughly three-quarters (73%) of respondents expect market conditions to improve in the year ahead, while 10% say conditions have worsened compared to one year ago.
- Multifamily, data centers, and the Manhattan office sector were key standouts in the survey. On the other hand, the industrial sector is viewed as operating within an oversupply cycle, with vacancies dampening investor appetite.
- Real estate executives believe that asset values are bottoming, with 59% expecting an improvement in valuations over the next year. Respondents also note that debt capital availability has rebounded from recent constraints, though raising equity remains difficult.
4. HOMEBUILDER SENTIMENT
- The NAHB-Wells Fargo Housing Market Index, which measures homebuilder sentiment, was unchanged at 32 in September, reflecting persistently weak builder sentiment.
- High mortgage rates and elevated construction costs continue to weigh on the housing market. Current sales conditions for single-family homes remained static, while prospective buyer traffic declined.
- Look-ahead expectations for the next six months improved from August to their strongest reading since March. It likely reflects that builders anticipate some relief from potential easing financial conditions as the Fed begins to lower rates.
- In September, 39% of builders reported cutting prices, the highest share in the post-pandemic period, with an average discount of 5%.
5. NATIONAL APARTMENT RENT COLLECTIONS
- According to the latest Chandan Economics-RentRedi Independent Landlord Rental Performance Report, on-time rent payments jumped by 58 basis points (bps) in September, rising to 83.1%.
- August’s on-time rate was revised down to 82.6%, a decrease from the previous month. The improvement in September offers hope that tenant financials are turning around, but on-time payments remain down a sizable 227 basis points year-over-year.
- Late payments have been the primary source of underperformance in the mom-and-pop sector, as full payment rates have remained relatively stable.
- Western states continue to hold the highest on-time payment rates in the country, led by South Dakota, Hawaii, and Utah.
- 2–4-unit rentals had the highest on-time payment rates by property type in September, at 83.7%. Single-family rentals were next at 83.3%, followed by multifamily at 81.7%
6. BOND YIELD SWINGS DRIVE VOLATILITY
- According to a recent report from Oxford Economics, the recent swings in bond yields are driving the most acute changes in property returns, and are most apparent in CRE markets with low cap rates.
- Treasury yields have seen increased volatility this year against the backdrop of policy uncertainty. The Oxford report suggests that a permanent shift in long-term bond yields can trigger sharper valuation swings in the property market compared to GDP contractions or inflation jumps.
- In most US markets, a 1% contraction in GDP leads to a 1.4-2% decline in capital returns, while a 1% increase in consumer prices results in a 0.3-1.8% decrease in returns, with retail assets being more affected than industrial assets.
- Meanwhile, bond yield movements hit metros and sectors with low discount rates particularly hard. The study highlights San Francisco as an example, where yield changes cause real estate yield spreads to compress, amplifying the impact of price movements where cap rates are lowest.
- Impacts vary by sector. Retail values are highly sensitive to interest rate fluctuations, while industrial assets tend to react more to direct demand contractions compared to rate changes. Residential assets show less exposure to sharp swings in bond markets.
7. TRANSACTION VOLUME REBOUNDS
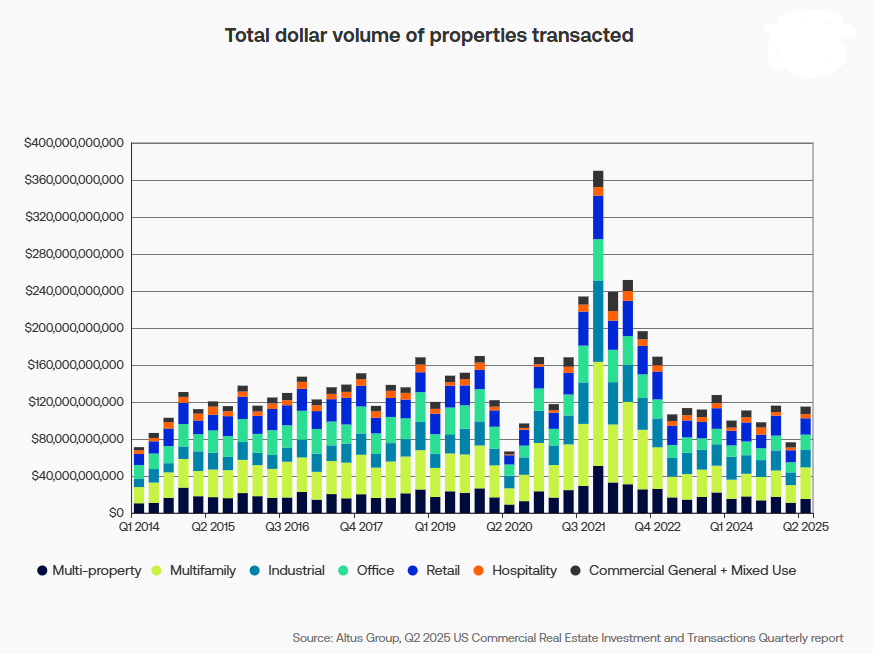
- Aggregate Commercial Real Estate transaction volume totaled $115 billion in the second quarter of 2025, a 3.8% increase from one year before, according to Altus Group.
- The uptick was driven by rising multifamily (+39.5%) and office (+11.8%) transactions. Still, the average number of properties transacted per day increased across all property types compared to the first quarter.
- The median price per square foot for transacted single properties rose 5.0% from the first quarter and 13.9% year-over-year across all sectors.
- Notably, most coastal metros outperformed national trends on a year-over-year basis. New York and San Francisco were exceptions.
- Across the 15 subsectors tracked by Altus Group, 13 of them saw quarterly increases in average prices. The automotive sector (+25.4%) led increases in cost per square foot during the quarter, followed by limited-service hotels (+17.2%) and medical offices (+15.1%).
8. CMBS DELINQUENCIES
- According to Trepp, CMBS delinquencies rose again in August as the Office and Multifamily delinquency rate hit fresh highs.
- It was the sixth consecutive monthly increase in the delinquency rate, rising six basis points to 7.29%.
- The multifamily delinquency rate climbed 71 basis points to a nine-year high of 6.86%. Meanwhile, the office rate rose 62 basis points to an all-time high of 11.6%
- Retail delinquencies declined by 48 basis points to 6.42%, marking their lowest level in the past year.
- Industrial delinquencies remain the lowest of all major property types, but also rose, climbing eight basis points from July to 0.6%. The rate for lodging fell five basis points to 6.54%.
- The share of loans that are seriously delinquent (60+ days delinquent, in foreclosure, REO, or non-performing balloon) is up five basis points in August to 6.88%.
9. RETAIL SALES
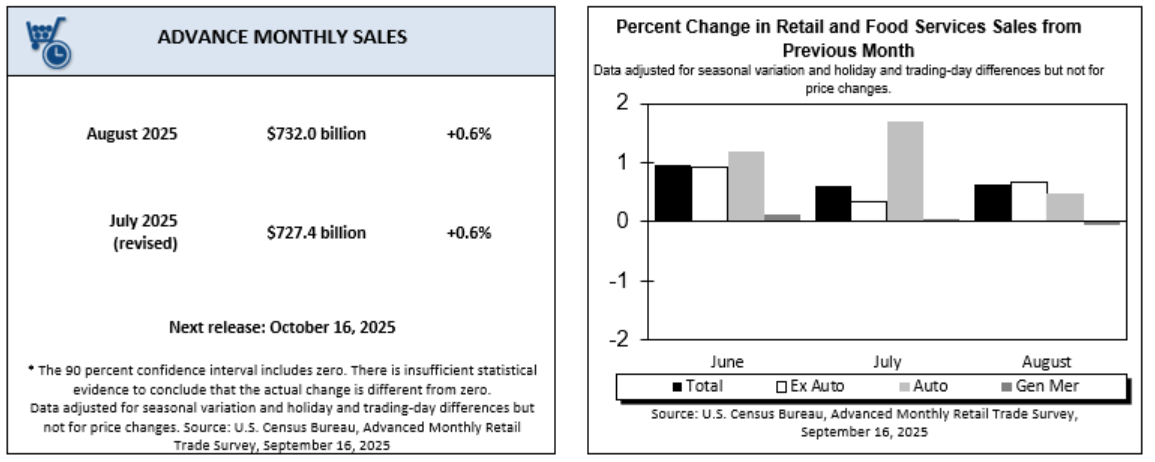
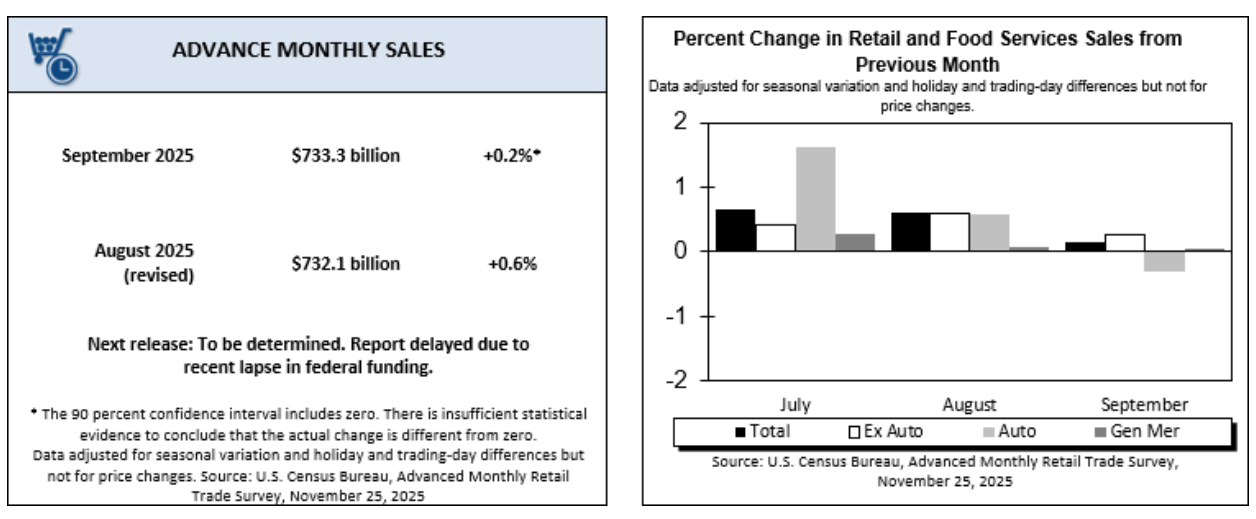
- According to advanced estimates from the US Census Bureau, retail and food services rose 0.6% month-over-month in August and 4.8% over the past 12 months, reaching $732 billion.
- Retail sales performance exceeded median forecasts, bolstering the case that consumer demand remains resilient in the face of heightened uncertainty. Excluding more volatile components like autos, building materials, and fuel, core retail activity was up 0.7% from July, signaling stable demand for discretionary goods.
- Non-store retailers increased by 10.1% year-over-year, while food services and drinking places rose by 6.5%.
10. NEW HOME SALES
- The annual rate of growth for single-family home sales jumped by 20.5% between July and August and by 15.4% year-over-year, according to the latest Census Bureau data. It marks the strongest monthly gain since 2020.
- The US is now on pace for 800,000 total new home sales by the end of the year. Homebuying activity has regained steam lately despite continued affordability pressures.
- Inventory became tighter in August, with the number of homes for sale on the market dropping to 490,000 units. End-of-August inventory volume amounts to 7.4 months of supply, compared to 9.0 months’ supply registered in July. It suggests that demand is outpacing construction, which could place upward pressure on home prices if sustained.
- The median price for a new single-family home sold rose to $413,000, up 4.7% month-over-month and 1.9% annually.
SUMMARY OF SOURCES
1. FED MINUTES AND JACKSON HOLE SPEECH
- Last week saw the release of the Fed’s July meeting minutes and Jerome Powell’s highly anticipated speech at Jackson Hole.
- The July minutes showed that a large majority of officials supported keeping rates unchanged, with two dissenting out of concern for a weakening job market. However, with officials continuing to advocate for a data-dependent approach to rate decisions, the recent weaker-than-expected July hiring data has increased the likelihood that they will act in September.
- At his Jackson Hole speech, Fed Chair Jerome Powell signaled that policymakers are shifting their emphasis toward labor market risks, acknowledging that current downside risks to employment are becoming an increasingly urgent threat.
- Equity and futures markets reacted to the speech dovishly, increasingly expecting a September pivot to rate cuts.
2. COMMERCIAL PROPERTY PRICES
- Commercial real estate prices rose in July, with each of the four major sectors rising on an annual basis for the second consecutive month—a first since mid-2022.
- According to MSCI-RCA, commercial prices rose 0.6% nationally on a month-over-month basis and 0.9% year-over-year.
- Industrial climbed the highest of the four sectors month-over-month, rising 0.7%, and rising 3.4% annually. Office rose 0.8% from June and 2.3% year-over-year.
- Retail prices were up 0.3% from June and 4.2% over the past 12 months. Apartment prices were flat from June but up 0.4% year-over-year.
- The monthly increase, if annualized, would imply a 7.7% growth rate for CRE over the next 12 months. MSCi-RCA reports that investor sentiment has been growing cautiously optimistic about the second half of 2025, as investment activity improved during the first half of 2025 compared to the same period last year.
- Investors are also eyeing expected autumn rate cuts by the Federal Reserve as a potential opportunity to create more favorable conditions for a market rebound.
3. RECOVERY OUTPACES RECESSION IN CRE
- Recent insights from Integra Realty Resources (IRR) suggest that there are now more markets in recovery than in recession for the first time in several years, though confidence remains uneven.
- Office vacancies remain elevated but show signs of stabilization in several Sun Belt metros, such as Miami and Charleston. Still, the performance gap between Class A and commodity space persists and is widening while new construction has slowed significantly.
- Multifamily is stabilizing nationally, with cities like Chicago, Philadelphia, and Minneapolis experiencing greater stability as new supply slows. Markets in the South and West, such as Phoenix and Austin, continue to adjust to the increased supply that has been delivered over the past two years.
- Retail has outperformed expectations, specifically in many mixed-use and grocery-anchored locations. The report notes Austin, Tampa, and Orange County (CA) as standouts in rent growth, while urban cores that rely on older mall formats, such as Detroit and San Francisco, continue to face headwinds.
- The industrial sector remains healthy but is entering a transition period, with vacancies on the rise in metros like Dallas-Fort Worth and Indianapolis, as new supply deliveries outpace absorption. Rent growth continues to fall in oversupplied areas.
4. BUILDER SENTIMENT
- According to the NAHB Housing Market Index, builder sentiment edged down from 33 in July to 32 in August, matching June’s mark for the lowest level since December 2022.
- 37% of builders reported cutting prices in July to try to boost demand, while 66% reported offering sales incentives—a post-pandemic high. Many builders continue to express pessimism about the near-term outlook, citing high mortgage rates and regulatory hurdles on land and construction as headwinds to the housing market.
- Current sales conditions declined to 35, while future sales expectations remained unchanged from July at 43. Buyer traffic rose to 22 but remains low by historical standards.
5. BUILDING PERMITS & STARTS
- According to the latest data from the US Census Bureau, US building permits declined 2.8% between June and July to a seasonally adjusted annual rate of 1.35 million. Permitting is down by 5.7% compared to July 2024.
- Permits for single-family homes rose 0.5% from June to an annual rate of 870,000 in July. Multifamily permitting fell slightly to an annualized rate of 430,000.
- Privately owned housing starts rose 5.2% month-over-month to an annualized rate of 1.42 million and stand 12.9% above the July 2024 rate of 1.26 million.
- Housing completions rose 6.0% month-over-month to a seasonally adjusted annualized rate of 1.41 million. However, the pace of completions is 13.5% below that of one year ago.
6. NATIONAL RENT COLLECTIONS
- On-time rental payments in independently operated units improved in August 2025 — a positive development for a sector that has been plagued by declining performance for most of the year. On-time rent collections remain down substantially from a year earlier.
- End-of-month rent collections have performed better, indicating a rise in renters paying late. The three-month moving average of late payments in independently operated rentals has risen consistently since the middle of 2024, climbing from a low of 8.8% to a high of 11.7% in June 2025.
- Late payment rates typically drop off in the spring as many households receive their tax refunds. However, the sustained recent surge in late payments may indicate a structural misalignment of household cash flows.
- At the state level, continuing a consistent trend, properties in the West outperformed the rest of the country. On-time payment rates were highest in Montana (94.9%) during August, followed by South Dakota (93.3%), Hawaii (92.5%), and Wyoming (92.3%).
7. CRE DELINQUENCIES RISE
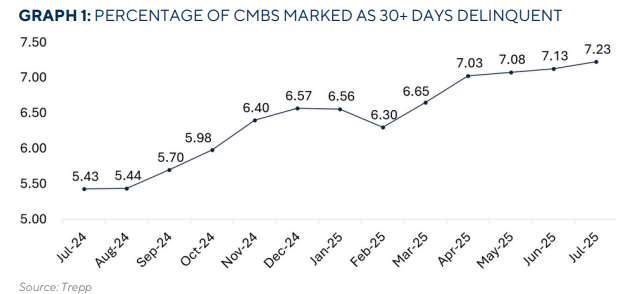
- According to Trepp, CMBS delinquencies rose for the fifth consecutive month in July, up 10 basis points to 7.23%. Rising distress in the CMBS market can signal tightening credit conditions and greater financing risk in commercial real estate.
- Last month’s rise in overall delinquencies can be mainly attributed to an uptick in Multifamily loan distress. The Multifamily delinquency rate climbed the highest month-over-month, up 23 basis points to 6.14% in July. Industrial was the only other sector to see delinquencies climb, rising one basis point to 0.52%.
- Lodging saw the largest monthly decline in delinquency, with the rate dropping 21 basis points to 6.52% in July. Retail fell 10 basis points to 6.59%
- Meanwhile, the Office delinquency rate declined from an all-time high of 11.08% in June to 10.91% in July.
8. WILDFIRE DAMAGE AND MORTGAGE RISK
- According to a recent study by Cotality, as wildfire-related property losses rise, contractor shortages and soaring rebuilding costs are colliding with an underinsurance problem, putting mortgages and recovery efforts at risk.
- Insurance-to-value problems are becoming more noticeable in places like California following this year’s devastating wildfires.
- In many cases, reconstruction costs now exceed the policy dwelling limit that homeowners are capped at, leaving insured households left to foot often prohibitive rebuilding costs even after claims are paid out.
- Cotality notes that this could have a domino effect on the mortgage market. Existing homeowners facing high and inelastic reconstruction costs are already driving mortgage delinquencies in affected areas. Meanwhile, property insurance requirements on loans underwritten by Fannie and Freddie Mac will likely prohibit many first-time homebuyers in a high-interest-rate environment.
9. CBO: TARIFFS TO REDUCE DEFICIT
- A recent forecast conducted by the Congressional Budget Office (CBO) estimates that the tariffs implemented during the period from January 6, 2025, to August 19 will reduce the US budget deficit by $3.3 trillion if they remain in place through 2035.
- The CBO also projects that if tariff revenues reduce the need for government borrowing, it would reduce federal outlays for interest by an additional $0.7 trillion.
- The forecast is accompanied by a high degree of uncertainty, given the lack of recent precedents for tariff policy. However, the CBO’s methodology accounts for some diversion of trade away from countries facing high tariffs and toward those facing lower tariffs.
- The latest CBO analysis updates the forecast to reflect changes in trade policy since May 13. A previous forecast conducted using changes up to May 13 had projected a $2.5 trillion deficit decrease, highlighting the additional revenue impact of the White House’s latest measures.
10. CONSUMER CONFIDENCE
- According to data from the Conference Board, consumer confidence was little changed in August, with its index falling 1.3 points as rising worries about jobs and income offset slightly more optimistic views of current and future business conditions.
- Consumers’ view of current business and labor market conditions fell over the month, driven by a worsening labor market outlook.
- Meanwhile, the expectations index, which is based on consumers’ short-term outlook for income, business, and labor conditions, declined by 1.2 points from June. Expectations remained below 80, a threshold that typically signals a recession ahead.
- Notably, consumers’ gauge of current job availability declined for an eighth consecutive month.
SUMMARY OF SOURCES
Auto real estate is a unique and profitable segment of commercial property, and auto shops continue to be in high demand. Whether you’re preparing your auto repair shop for sale, looking for an auto shop for lease, or exploring investment opportunities, understanding the market is the key to maximizing your returns. This guide covers everything from selling strategies to leasing insights, investment tips, and working with professionals in auto shop real estate.
Search for available auto repair shops here.
Selling Your Auto Repair Property

Preparing Your Auto Repair Shop for Sale
- Declutter and deep clean
When listing a car repair shop for sale, a spotless and organized environment speaks volumes to potential buyers. Remove outdated equipment, scrap materials, and clutter so buyers can clearly see the workspace. A clean shop allows them to visualize their business operating in the space.
- Make repairs and upgrades
Before marketing your repair shop for sale, address visible issues like cracked floors, peeling paint, and flickering lights. Simple improvements—fresh paint, new signage, or upgraded lighting—can greatly improve curb appeal. Updating equipment, especially lifts or diagnostic tools, can also justify a higher asking price.
- Stay compliant
Buyers looking for an auto repair shop for sale want confidence that the property meets environmental, safety, and zoning regulations. Being fully compliant removes obstacles during inspections and makes your property more attractive. It also allows buyers to begin operations immediately after purchase.
- Organize records
If your sale includes the business, prepare financial statements, customer history, and maintenance records. This transparency builds buyer trust and can strengthen negotiations. Even for a stand-alone property sale, documentation such as occupancy history and utility costs is valuable.
Valuation Tips and Market Trends
- Get a professional appraisal
A certified commercial appraiser will evaluate your auto shop for sale based on location, size, condition, and comparable properties. This ensures your asking price is competitive and attractive to serious buyers. A realistic valuation prevents delays and maximizes your sale price.
- Factor in location, equipment, and goodwill
A car body shop for sale in a high-traffic location with strong visibility will naturally draw more interest. If the business is part of the sale, the value of loyal customers, skilled staff, and brand reputation—known as goodwill—should be factored in. Specialized equipment and facility upgrades can further boost value.
- Watch market trends
Demand for auto real estate remains strong thanks to the aging U.S. vehicle fleet and longer car lifespans. Certain markets see higher appreciation rates for auto repair properties due to limited supply. Understanding these trends helps sellers choose the best time to list.
- Highlight expansion potential
Buyers often pay more for a property with room to grow. Whether it’s space for additional bays, storage, or EV charging stations, expansion potential makes your repair shop for sale more appealing. Highlighting these possibilities can increase perceived value.
How to Attract Buyers
- List on industry-specific marketplaces
Auto shop real estate sells faster when marketed where buyers are actively searching. Listing on niche automotive and commercial real estate sites ensures your property reaches mechanics, entrepreneurs, and investors. These platforms attract people specifically searching for terms like “auto body shop for sale” or “auto repair shop for sale.”
- Showcase features
Include professional photos and descriptions of lifts, diagnostic tools, and customer amenities. Highlight upgrades like EV repair readiness or specialized paint booths if you have a car body shop for sale. Unique features can help your property stand out in a competitive market.
- Emphasize location benefits
Visibility, storage and parking, and proximity to dealerships or parts suppliers are powerful selling points. Buyers know that location can directly impact revenue. Make sure these advantages are front and center in your listing.
- Offer flexible terms
Flexible arrangements like seller financing or a lease-to-own deal can attract more potential buyers. These options can also help you sell faster without lowering your asking price. For investors, such terms can make an auto repair property for lease even more attractive.
Leasing Auto Real Estate

Pros and Cons of Leasing vs. Buying
- Leasing Pros
Leasing an auto shop provides flexibility and lower upfront costs, freeing up capital for business operations. It also shifts certain maintenance responsibilities to the landlord. For new businesses, leasing reduces financial risk while still securing a prime location.
- Leasing Cons
When leasing, you won’t build equity in the property, and rent can increase over time. There may also be restrictions on renovations or services you can offer. Lease agreements for auto repair property for lease can be complex, requiring careful review.
- Buying Pros
Owning an auto repair shop for sale gives you long-term control and the ability to customize the space to your exact needs. Property ownership also builds equity and can provide rental income if you choose to sublease part of the facility. It’s a solid wealth-building strategy for established businesses.
- Buying Cons
Buying requires a larger upfront investment and comes with full responsibility for maintenance and taxes. It also ties you to one location, which may limit flexibility if your customer base shifts. For some, this commitment can be a disadvantage compared to leasing.
Finding the Right Auto Shop for Lease
- Search for high-visibility locations
An auto shop for lease in a visible, easily accessible area will attract more customers. Look for properties near busy intersections or main roads to increase foot and vehicle traffic. High visibility can help new businesses establish themselves quickly.
- Consider size and layout
The property should have a practical floor plan with enough bays, storage, and customer areas. A well-laid-out auto repair property for lease can improve workflow efficiency. Future growth potential should also be considered when evaluating size.
- Check zoning regulations
Confirm the property is zoned for automotive use before signing a lease. Some areas have restrictions on noise levels, hazardous materials, or certain repair types. Verifying zoning compliance protects you from legal headaches.
Finding the Right Auto Shop for Lease
- Term length and renewal options
A favorable lease term provides stability for your business operations. Renewal clauses ensure you can extend your lease without losing your location to another tenant. Long-term leases are especially valuable for building a loyal customer base.
- Maintenance responsibilities
Clearly outline who is responsible for maintaining building systems, exterior areas, and specialized equipment. Having the landlord handle major repairs can save you significant expenses. Avoid vague terms that might lead to disputes later.
- Permitted uses and restrictions
Some leases restrict certain automotive services, such as paintwork or body repairs. Make sure these limitations won’t hurt your revenue potential. For example, if you plan to operate as a car body shop for sale in the future, the lease should allow it.
- Exit clauses
An exit clause provides flexibility if business needs change unexpectedly. This could include relocation options or lease termination under certain conditions. It’s a safeguard that helps you adapt to market shifts.
Investment Opportunities in Auto Shop Real Estate

Why Investors Are Eyeing This Sector
- Auto real estate attracts investors because it serves a steady, recession-resistant demand. Mechanics, dealerships, and fleet service companies all need specialized facilities. This ensures consistent occupancy rates and predictable returns.
ROI Potential and Market Demand
- The U.S. auto repair industry is expected to reach $134 billion by 2033, fueling demand for facilities. Investing in an auto body shop for sale or a car repair shop for sale in a prime location can deliver both rental income and long-term appreciation. With the right tenant, these properties can be low-maintenance, high-yield investments.
Case Studies / Success Stories
- An investor purchased a vacant auto shop, upgraded it for EV readiness, and leased it to a specialty repair business. The improvements attracted a high-quality, long-term tenant, boosting property value by 25% in two years. Strategic upgrades can significantly enhance both rental and resale potential.
Working with Auto Real Estate Professionals

Benefits of Using Specialized Brokers or Agents
- Auto shop real estate transactions involve unique zoning, environmental, and operational considerations. Specialized brokers understand these challenges and know how to market effectively to industry-specific buyers. They can also help investors identify undervalued opportunities.
What to Look for in a Service Provider
- Seek an agent with experience in auto repair shop for sale and auto shop for lease transactions. They should have a strong network of industry contacts and access to niche marketing channels. Local market expertise is essential for accurate pricing and positioning.
How They Help with Auto Shop for Sale or Lease Listings
- A professional broker will handle everything from pricing strategy to negotiations, ensuring you get the best possible terms. They can create compelling listings for your repair shop for sale and connect you with motivated buyers or tenants. Their expertise can save you time and protect your bottom line.
Conclusion
Recap of the Importance of Tailored Auto Real Estate Services
Selling, leasing, or investing in auto real estate requires an understanding of specialized market factors. From zoning laws to equipment valuation, a tailored approach ensures you make informed decisions. Partnering with experts can help you navigate these complexities with confidence.
Encouragement to Explore Opportunities in Buying, Selling, or Leasing
With demand for repair facilities rising, now is the perfect time to explore opportunities in auto shop real estate. Whether you’re listing a car body shop for sale, leasing a repair shop, or investing in an auto repair property for lease, the market offers strong potential for returns.
Contact a Professional or Start Browsing Listings
Don’t wait for the market to pass you by. Contact a specialized broker today at svnauto.com to start browsing auto shop for sale and auto shop for lease listings in your area. The right move now could secure a profitable future. Looking for property management services? Contact us for support.

SHAREABLE FLIPBOOK DOWNLOADABLE PDF
As a whole, the automotive real estate market is showing steady growth, rising on average ~51% since 2014 and accounting for a growing share of transaction value. Automotive sale-leasebacks are becoming increasingly common because they free up capital previously tied up in real estate while allowing the company to keep operating in the same location.
Auto Real Estate Solutions
We provide expert real estate solutions tailored to auto-related businesses, including auto repair shops, car dealerships, tire centers, body shops, and smog stations. From property acquisition and leasing to site selection and investment sales, we understand the unique zoning, power, access, and layout requirements of the automotive industry. Our Orange County, California market knowledge ensures your business is positioned for operational efficiency, visibility, and long-term success.
Whether you have an auto shop for sale, an auto repair shop sale, or looking for an auto shop for lease, SVN Auto advisors in Orange County and greater Southern California can help you achieve your investment goals.
Auto repair shop areas we support:
- Aliso Viejo
- Anaheim
- Brea
- Buena Park
- Costa Mesa
- Cypress
- Dana Point
- Fountain Valley
- Fullerton
- Garden Grove
- Huntington Beach
- Irvine
- La Habra
- La Palma
- Laguna Beach
- Laguna Hills
- Laguna Niguel
- Laguna Woods
- Lake Forest
- Los Alamitos
- Mission Viejo
- Newport Beach
- Orange
- Placentia
- Rancho Santa Margarita
- San Clemente
- San Juan Capistrano
- Santa Ana
- Seal Beach
- Stanton
- Tustin
- Villa Park
- Westminster
- Yorba Linda
Automotive real estate refers to properties specifically designed or zoned for automotive uses. Types of auto real estate properties include auto repair shops, tire and lube centers, body shops, smog stations, car washes, gas stations, and vehicle dealerships.
Zoning constraints, environmental regulations, power needs, ventilation, drainage, and ingress/egress requirements have reduced the auto real estate market to a niche investment, but that is quickly changing. While the factors mentioned limit supply— demand is rising. More vehicles on the road, the expansion of EV services, and a surge in independent operators are driving increased investor and operator interest in this high-cash-flow, low-vacancy asset class.
Our Guide to Finding the Best Auto Shop For Sale
If you’re an auto shop owner looking to expand or relocate in Orange County, California or other areas of Southern California, follow our guide below to strategically find the right auto shop for sale or lease.
Why It’s Important to Have a Qualified Agent, who Specializes in Automotive Real Estate Transactions
It should be noted that not all brokers understand the zoning, utility, and compliance requirements to complete an auto real estate transaction. A specialized agent can identify off-market opportunities. Specialized agents can also verify zoning compatibility. A prospective owner or lessee should also keep in mind that specialized agents are experienced with negotiating based on buildout cost, equipment value, and environmental risk. One of our team members can also connect you with trusted vendors for Phase I reports, inspections, etc.

A qualified automotive real estate professional can help you identify the right areas to invest in. Not all areas are zoned for automotive use. Automotive use zonings can include: C-M, M-1, C-2, etc., depending on the city. With your advisor, narrow your search to identify properties that allow auto repair, sales, or storage.
Permits Required to Buy an Auto Shop For Sale
Another thing to confirm with your agent is that the properties you are interested in meet CUP (Conditional Use Permit) requirements if needed. A Conditional Use Permit (CUP) is a zoning approval granted by a city or county that allows a property to be used for a purpose not automatically permitted under its current zoning—but allowed under certain conditions. In auto real estate, this often applies to businesses like auto repair shops, body shops, car washes, smog stations, or used car lots, which can trigger community concerns related to noise, traffic, or hazardous materials.
Our advisors can also help you confirm whether or not the selected site might have a legal non-conforming status (grandfathered use) that allows for automotive operations. Legal non-conforming status—often called “grandfathered use”—means an automotive property was legally operating under older zoning rules before current restrictions took effect. Though the zoning has changed (e.g., to retail, residential, or mixed-use), the auto use is still allowed as long as it continues without interruption.
Contact SVN Vanguard, Your Automotive Real Estate Experts
Contact us to discuss your options when it comes to automotive commercial real estate or automotive property management in Orange County and greater Southern California. Email hello@svnauto.com or call us at 714-446-0600 to discuss your business needs.
